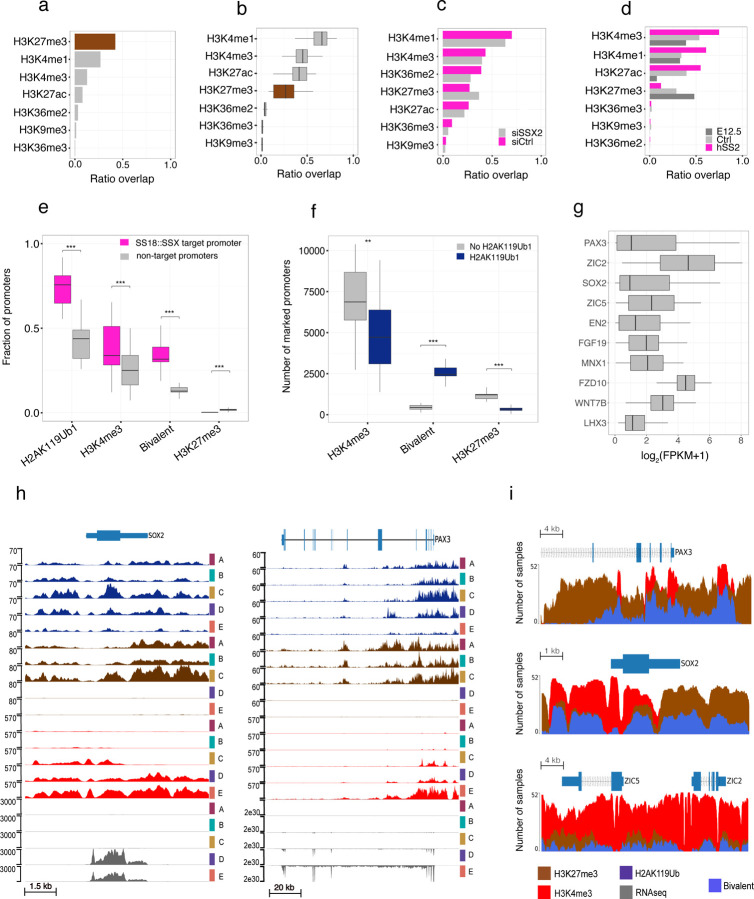
Figure 3. H2AK119Ub1 and variable target gene activation.
Fraction of genome wide H2AK119Ub1 occupancy overlapping other histone marks in (a) a non-SyS samples, (b) SyS tumors, (c) the SYO1 cell line treated with either siRNA against SSX2 (siSSX2) or scramble control (siCtrl), (d) HIC+ driven mouse tumor (hSS2), adult HIC+ MSCs (Ctrl) or embryonic MSCs (E12.5). (e) Fraction of protein coding promoters that are marked by H2AK119Ub1 and are either SS18::SSX targets or not. Promoters are then further subdivided into H3K4me3 (H2AK119Ub1 and H3K4me3 without H3K27me3), bivalent (H2AK119Ub1 and H3K4me3 and H3K27me3) or H3K27me3 (H2AK119Ub1 and H3K27me3 without H3K4me3). (f) The number of protein coding promoters marked by H3K4me3 (H3K4me3 without H3K27me3), bivalent (H3K4me3 and H3K27me3) or H3K27me3 (H3K27me3 without H3K4me3). Promoters are then further subdivided into being marked by H2AK119Ub1 or not. (g) Gene expression values of signature synovial sarcoma genes ordered by variance. (h) ChIP-seq signal enrichment and gene expression tracks for five SyS primary tumors at the SOX2 and PAX3 locus. H2AK119Ub1 (dark blue), H3K27me3 (brown), H3K4me3 (red) and gene expression (grey) are displayed. (i) Visual representation of peak calls for H3K4me3 (red), H3K27me3 (brown) or bivalent (blue) regions around the SOX2, PAX3, ZIC2 and ZIC5 genes. The amplitude represents the number of samples that have a called peak in that region. ** indicates P-value < 0.01, *** indicates P-value < 0.001 for a Welch two-sample t test.

