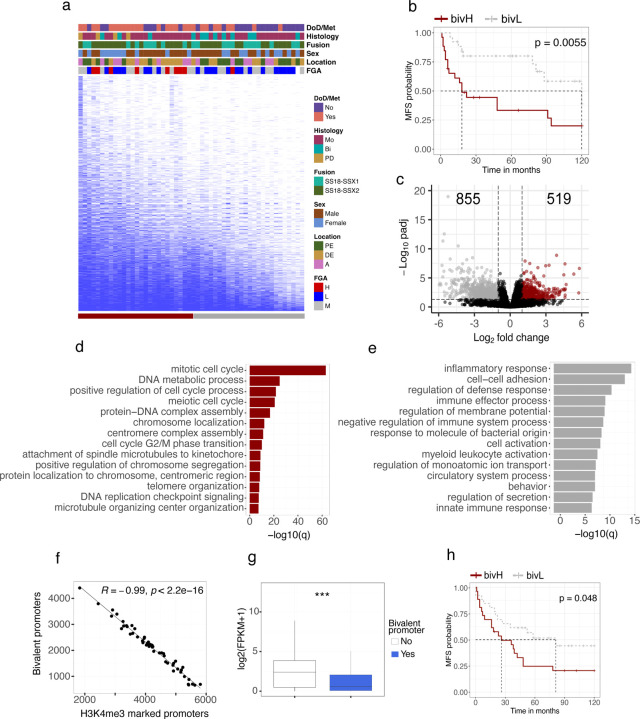
Figure 4. Bivalency is a prognostic marker for synovial sarcoma.
(a) Binary heatmap over bivalently marked promoters (rows) in synovial sarcoma samples (columns) ordered by the total number of marked promoters. (b) Kaplan–Meier (KM) analysis of metastasis-free survival (MFS) in bivalency high (bivH) and bivalency low (bivL) groups. Statistically significant difference between the curves was calculated using the log-rank test. (c) Volcano plot displaying the number of differentially expressed genes between the upper and lower quartiles of the bivH and bivL groups. Gene Ontology enrichment analysis of genes found to be (d) upregulated or (e) downregulated in the bivH quartile. (f) Spearman correlation between the number of bivalently marked promoters and the number of promoters marked by H3K4me3 only. (g) Box plot showing the gene expression values for promoters being either bivalently marked or not. (h) KM analysis of MFS in the validation set, comparing the difference in survival between tumors predicted to be bivH or bivL. Statistically significant difference between the curves was calculated using the log-rank test. *** indicates P-value < 0.001 for a Welch two-sample t test. Abbreviations: DoD, dead of disease; Met, metastasis; Bi, biphasic; Mo, monophasic; PD, poorly differentiated; A, axial; DE, distal extremity; PE, proximal extremity.

