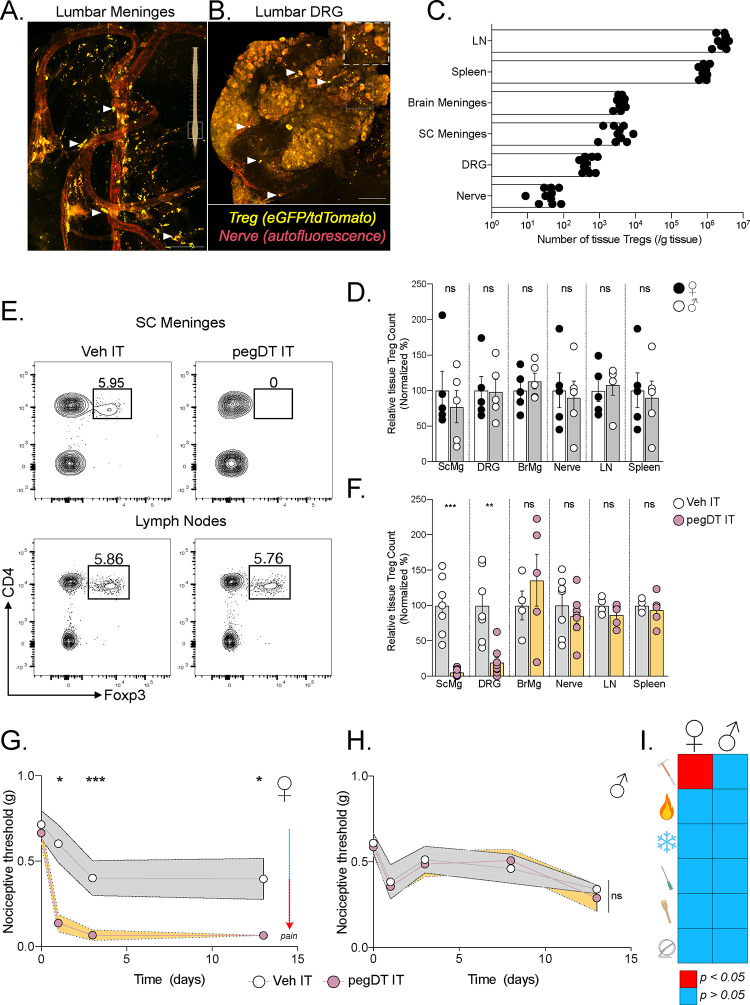
Figure 1. mTreg suppress mechanical pain hypersensitivity in female mice.
Representative whole mount maximum projection confocal microscopy image of the (A) lumbar spinal cord meninges and (B) DRG showing Tregs (green-red: yellow) and nerves (autofluorescence, red) in Foxp3eGFP-CreERT2;Rosa26tdTomato reporter mice. Inlet showing DRG magnification. Scale bar represents 100 μm in A) and 150 μm in B). Arrows indicate Tregs. (C) Total number of weight-adjusted tissue Tregs across organs, in both sexes combined. (D) Relative number of tissue Tregs from male (white) and female (black) mice per organ. 100% represents mean number of female Tregs per organ. Comparison is made between each individual organ. (E) Representative concatenated flow cytometry plots of tissue Treg after a single intrathecal (IT) injection of 20 ng of pegylated diphtheria toxin (pegDT). (F) Relative quantifications of tissue Treg depletion 2 days after a single IT pegDT injection across organs. 100% represents mean number of tissue Tregs in IT vehicle-injected mice per organ. (G and H) 50% paw withdrawal thresholds measured using von Frey filaments before (day 0) and after a single dose of 20 ng of IT pegDT or vehicle in female (G) or male (H) Foxp3-DTR mice. (I) Summary of significant behavioral differences comparing IT pegDT- and control-injected female and male mice. Total number of mice for G-I is presented in Figure S3. ScMg= Spinal cord meninges, BrMg= Brain meninges, LN= Lymph nodes, ns = not significant, *p<0.05, **p<0.01, ***p<0.001. Related to Figure S1–S3.

