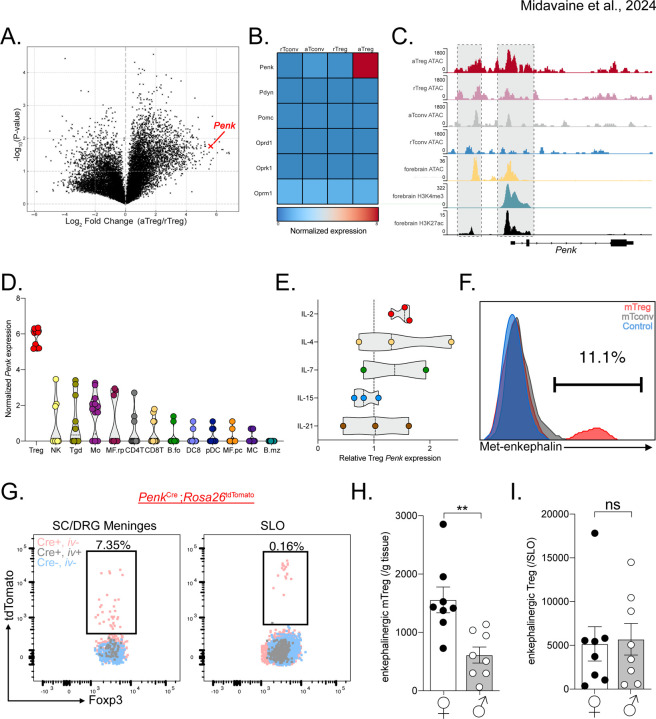
Figure 3. mTregs express and produce enkephalin.
(A) Volcano plot of transcription fold change of activated Treg (aTreg) vs resting Treg (rTreg) and (B) heatmap of relative log2 expression value of aTreg, rTreg and activated and resting CD4+ CD25− conventional T cells (aTconv and rTconv) from public dataset GSE154680 (n=3). (C) Averaged ATAC sequencing (ATACseq) of open chromatin accessibility peaks on the Penk locus in different T cell subsets (n=4 per group, GSE154680), compared to ATACseq, and histone modification Chip-Seq from public ENCODE dataset of the p0 developing forebrain, a known enkephalinergic region. (D and E) Log2 values of Penk expression by different unstimulated immune cell types from Immgen dataset GSE180020. (E) Treg Penk expression fold change after cytokine stimulation compared to vehicle control. (F) Representative PMA:Ionomycin stimulated mTregs, meningeal CD4+ T cells (mCD4) from WT mice or Penk−/− mTreg (control). (G) Representative flow cytometry plots of Tregs from meninges or secondary lymphoid organs (SLO) from PenkCreRosa26tdtomato mice. Pink represents non-vascular, tissue Tregs from transgenic Penk lineage reporter mice. Gray represents vascular Treg in reporter mice while Blue corresponds to tissue Treg from non-transgenic control mice. (H-I) Number of enkephalin lineage fate reporter positive tissue Tregs in (H) meninges and (I) secondary lymphoid organs (SLO) in male and female mice. NK: Natural Killer cells, Tgd: γδ T cells, Mo: Monocytes, MF.rp: Red pulp macrophages, CD4T: CD4+ T cells, CD8T: CD8+ T cells, B.fo: splenic follicular B cells, DC8: CD8+ dendritic cells, pDC: splenic plasmacytoid, MF.pc: peritoneal macrophages, MC: myeloid cells, B.mz: splenic marginal zone B cells, ns = not significant, *p<0.05, **p<0.01,***p<0.001.

