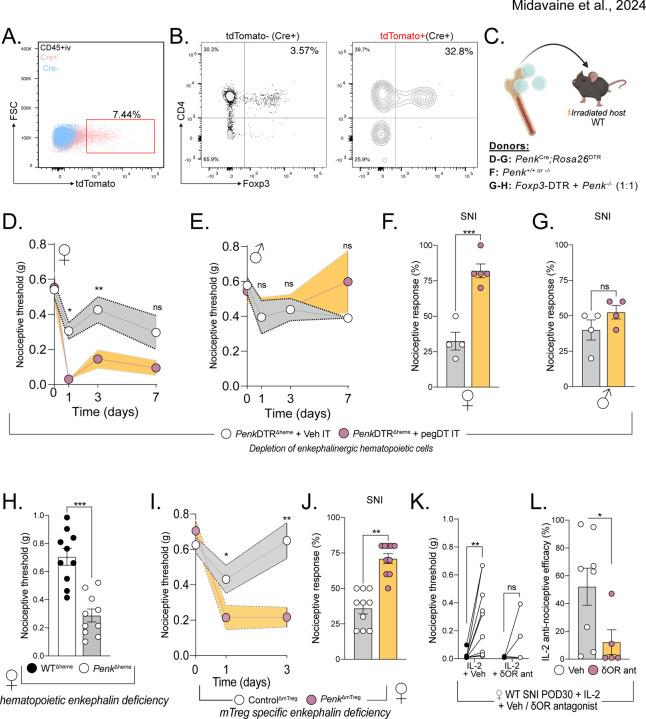
Figure 4. mTreg-derived enkephalin controls nociceptive thresholds.
(A) Representative flow cytometry plots of Cre positive (pink) or Cre negative (blue) CD45+ non-vascular cells from the meninges and the DRG, combined, from PenkCreRosa26tdTomato mice. (B) Flow plot shows representative tdTomato negative and right plot shows tdTomato positive leukocytes, demonstrating the more pronounced mTreg representation in the enkephalinergic fate cell population. (C) Schematic representation of bone marrow transplants to generate a global depletion of enkephalinergic cells, a depletion of hematopoietic-derived enkephalin or a depletion of Treg-derived enkephalin, respectively. (D-G) Bone marrow chimera of PenkCreRosa26DTR →irradiated WT recipients. Nociceptive thresholds after a single pegDT (pink) or vehicle (white) IT injection in female (D) and male (E) mice. n= 5 per group. Nociceptive thresholds after SNI and pegDT (pink) or vehicle (white) IT injection in female (F) and male (G) mice. (H) Nociceptive thresholds at baseline of female WT → WT (black) or Penk−/− WT → (white) bone marrow chimeras. (I) Female Foxp3-DTR + Penk−/− (1:1) → WT mice and tested for nociceptive thresholds after pegDT (pink) or vehicle (white) IT, n=10 per group. (J) Nociceptive thresholds in SNI mice after pegDT (pink) or vehicle (white) IT injections. (K) WT SNI female mice given low-dose IL-2 and naltrindole. (L) Nociceptive efficacy calculated as percent compared to baseline threshold. ns = not significant, *p<0.05, **p<0.01,***p<0.001.

