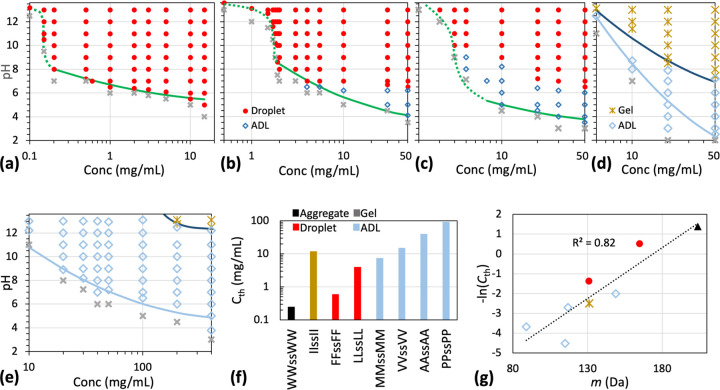
Fig. 3.
Phase diagrams and threshold concentrations at pH 7. (a-e) Phase diagrams of tetrapeptides with X = F, L, M, V, and A in 50 mM imidazole buffer. For LLssLL and MMssMM, the transition from ADLs to droplets spans 1 unit of pH values; in the transition region, the morphology is assigned to the dominant species. (f) Threshold concentrations for phase separation at pH 7. (g) Correlation between threshold concentration and amino-acid molecular mass.

