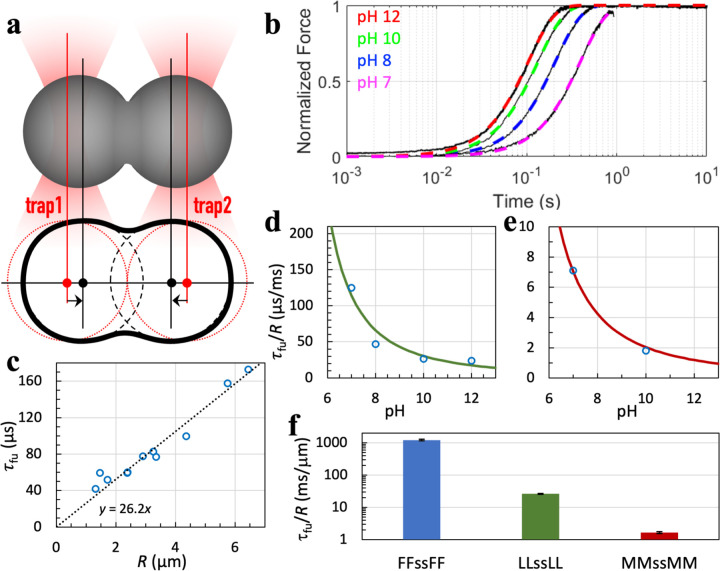
Fig. 4.
OT-directed droplet fusion. (a) Illustration of directed fusion. (b) Fusion progress curves of LLssLL droplets. Black traces show raw data; colored curves are fits to Eq [9]. Droplets were prepared at the indicated pH and grown to 3 to 4 μm in radius before fusion. (c) Fusion time of LLssLL droplets as a function of initial droplet radius. Each circle represents a fusion event. A line displays the proportional relation between fusion time and droplet radius. Droplets were prepared with 5.5 mg/mL LLssLL at pH 10. (d) Inverse fusion speed of LLssLL vs. pH. The curve displays a fit to Eq [2] with α fixed 2, pHc fixed at 3.8, and b adjusted to 1165. (e) Inverse fusion speed of MMssMM vs. pH. The curve displays a fit to Eq [2] with α fixed 2, pHc fixed at 3.5, and b adjusted to 86. (f) Inverse fusion speeds of droplets with X = F, L, and M at pH 10. Error bars represent the standard error in τfu/R as a fitting parameter.

