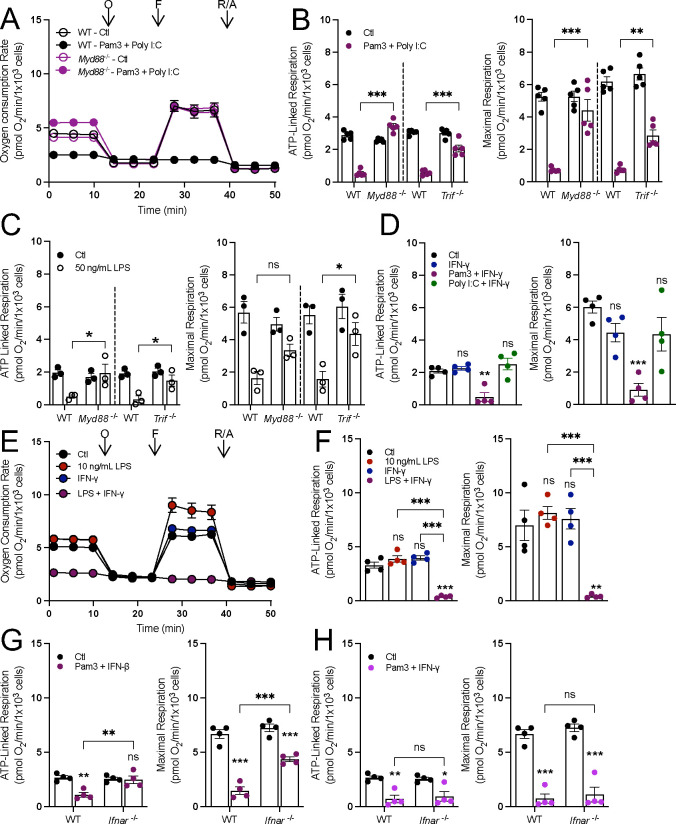
Figure 2: Both MyD88- and IFN-linked signaling are required to decreasing oxidative phosphorylation.
A) Representative oxygen consumption trace with wildtype (WT) or MyD88-null (Myd88−/−) control (Ctl) and BMDMs treated with Pam3 + Poly I:C for 24 hr. Where not visible, error bars are obscured by the symbol. O, oligomycin; F, carbonyl cyanide-p-trifluoromethoxyphenylhydrazone (FCCP); R/A, rotenone/antimycin A (n = 1 biological replicate with 5 technical replicates). B&C) ATP-linked and maximal respiration rates for wildtype (WT), MyD88-null (Myd88−/−), and TRIF-null (Trif−/−) control (Ctl) and BMDMs activated with Pam3 + Poly I:C (n = 5) (B) or 50 ng/mL LPS for 24 hr. (n = 3) (C). D) ATP-linked and maximal respiration rates for control (Ctl) and BMDMs treated with IFN-γ, Pam3 + IFN-γ, or Poly I:C + IFN-γ (n = 4). E&F) Representative oxygen consumption rates, where not visible, error bars are obscured by the symbol. O, oligomycin; F, FCCP; R/A, rotenone/antimycin A (n = 1 biological with 5 technical replicates) (E) and ATP-linked and maximal respiration for control BMDMs (Ctl) and BMDMs activated with 10 ng/mL LPS, 20 ng/mL IFNgamma, or LPS + IFNgamma for 24 hr. (n=4) (F). G&H) ATP-linked and maximal respiration of WT and IFNAR-null (Ifnar−/−) control (Ctl) and BMDMs activated with Pam3 + IFNβ (n = 4) (G) or Pam3 + IFN-γ (n = 4) (H). All data are mean ± SEM with statistical analysis conducted on data from biological replicates, each of which included multiple technical replicates, unless otherwise indicated. Statistical analysis for (B), (C), (G), and (H) was performed as an ordinary two-way, ANOVA followed by Sídák’s post hoc multiple comparisons test. Statistical analysis for (D) and (F) was performed as an ordinary one-way, ANOVA followed by Tukey’s post hoc multiple comparisons test.

