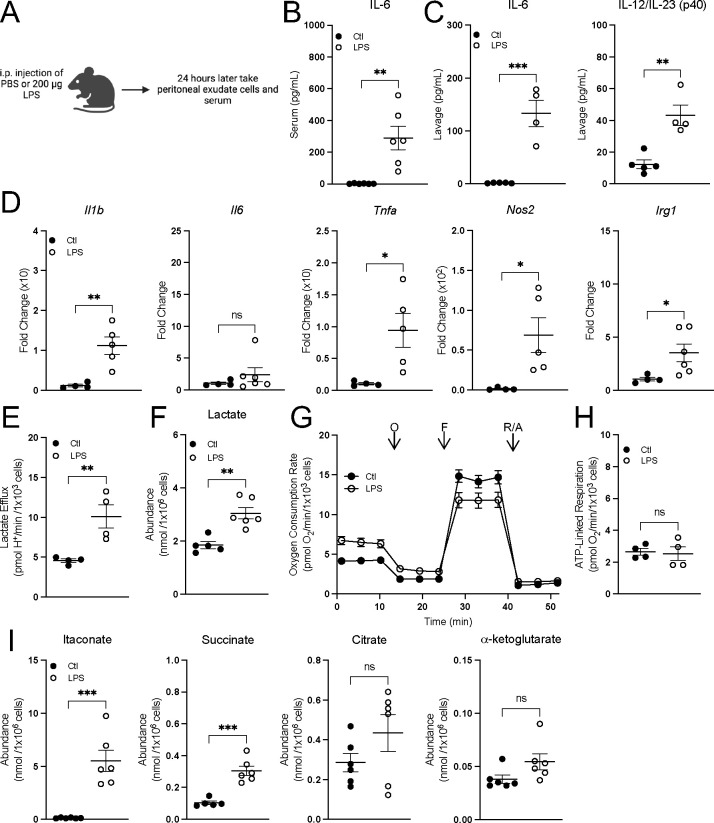
Figure 7: Peritoneal macrophages activated in vivo preserve oxidative phosphorylation and accumulate pro-inflammatory metabolites.
A) A schematic depicting the experimental design for peritoneal macrophages. B&C) Cytokine levels from serum (n = 5–6) (B) and lavage fluid from mice intraperitoneally injected with PBS or LPS for 24 hr. (n = 4–6) (C). D) Pro-inflammatory gene expression from peritoneal macrophages isolated from mice intraperitoneally injected with PBS or LPS for 24 hr. relative to control (Ctl) (n = 4–6). E) Lactate efflux rates for peritoneal macrophages isolated from mice intraperitoneally injected with PBS or LPS for 24 hr. (n = 4). F) Intracellular lactate abundance from peritoneal macrophages isolated from mice intraperitoneally injected with PBS or LPS for 24 hr. (n = 5–6). G) Representative oxygen consumption trace with peritoneal macrophages isolated from mice intraperitoneally injected with PBS or LPS for 24 hr. Where not visible, error bars are obscured by the symbol. O, oligomycin; F, carbonyl cyanide-p-trifluoromethoxyphenylhydrazone (FCCP); R/A, rotenone/antimycin A (n = 1 biological replicate with 5 technical replicates). H) ATP-Linked respiration rates for peritoneal macrophages isolated from mice intraperitoneally injected with PBS or LPS for 24 hr. (n = 4). I) Intracellular itaconate, succinate, citrate and α-ketoglutarate abundances from peritoneal macrophages isolated from mice intraperitoneally injected with PBS or LPS for 24 hr. (n = 6). All data are mean ± SEM with statistical analysis conducted on data from biological replicates, each of which included multiple technical replicates, unless otherwise indicated. Statistical analysis for (B-F) and (H-I) was performed as an an unpaired, two-tailed t-test.

