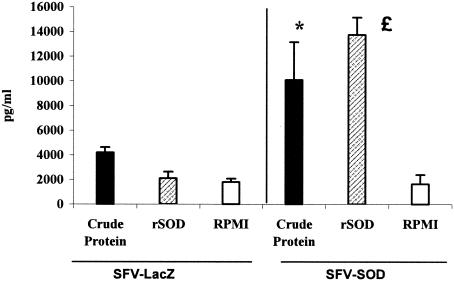
FIG. 3.
Quantitative ELISA analysis of IFN-γ secreted by lymphocytes upon stimulation with different antigens. Splenocytes (4 × 10⁵ cells per well) from five mice of each group were pooled and stimulated in vitro with CBPs (4 μg/ml), rSOD (0.4 μg/ml), or RPMI 1640 (negative control) for 48 h. The data are representative of the data from two separate experiments. Each bar indicates the geometric mean of the response, and the error bars indicate standard deviations. The asterisk and the pound sign indicate statistically significant differences compared to RPMI 1640 (P < 0.01 and P < 0.0002, respectively).

