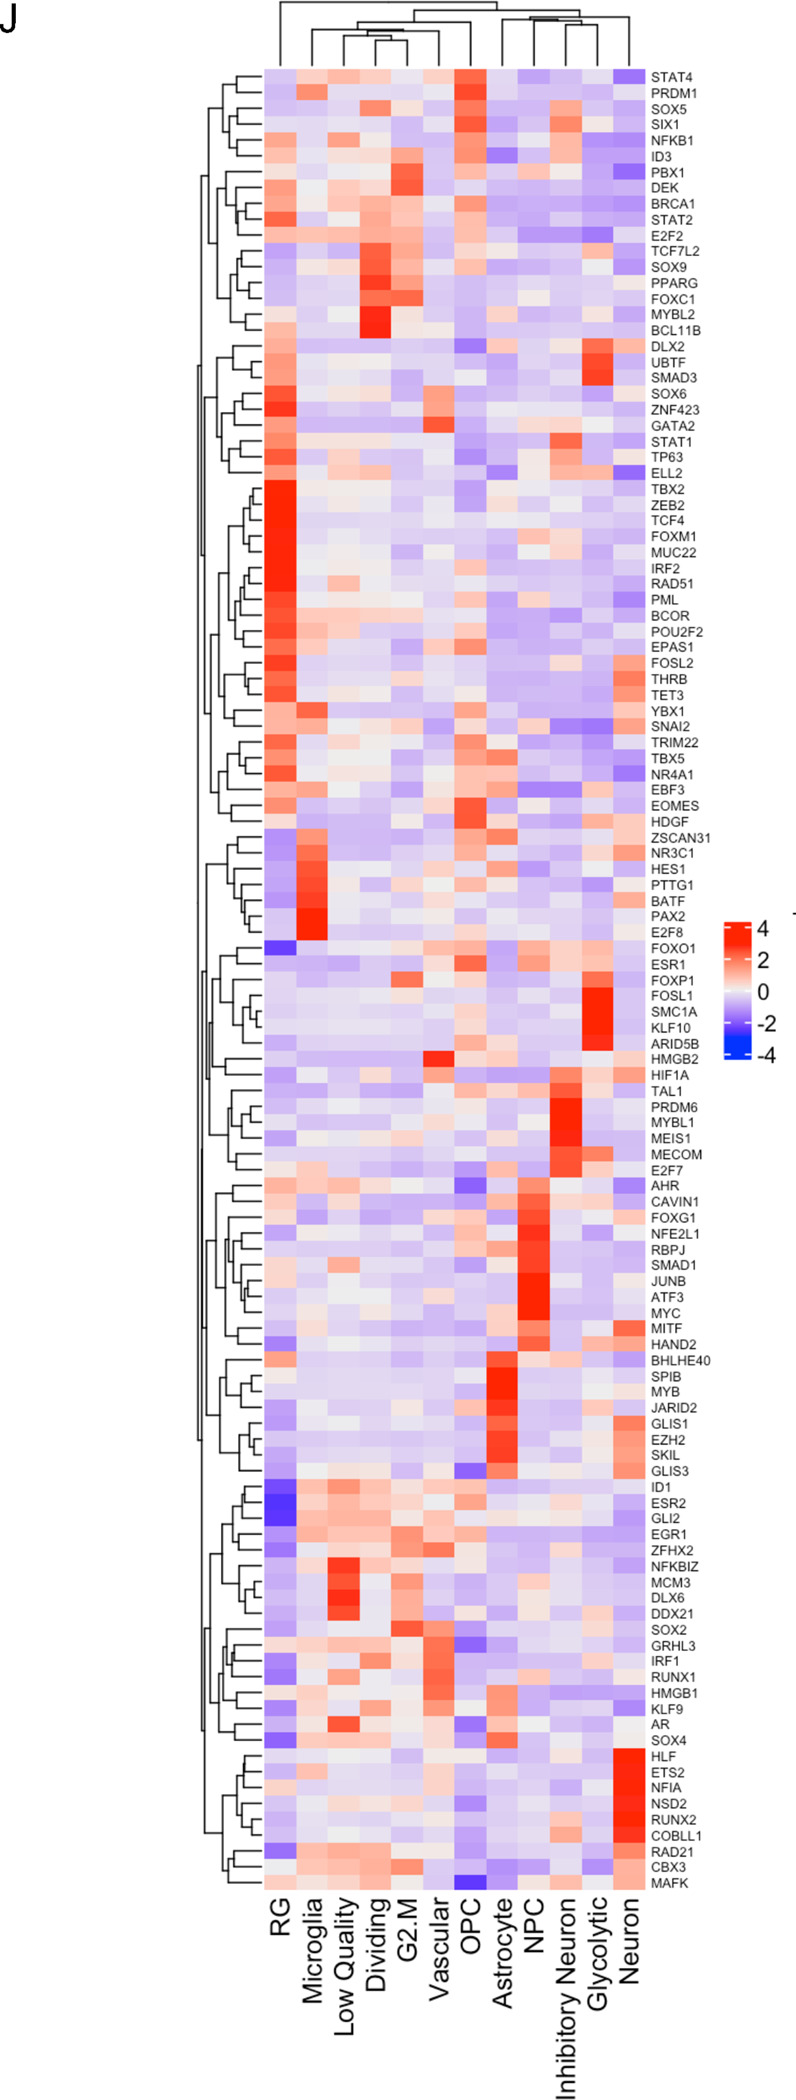
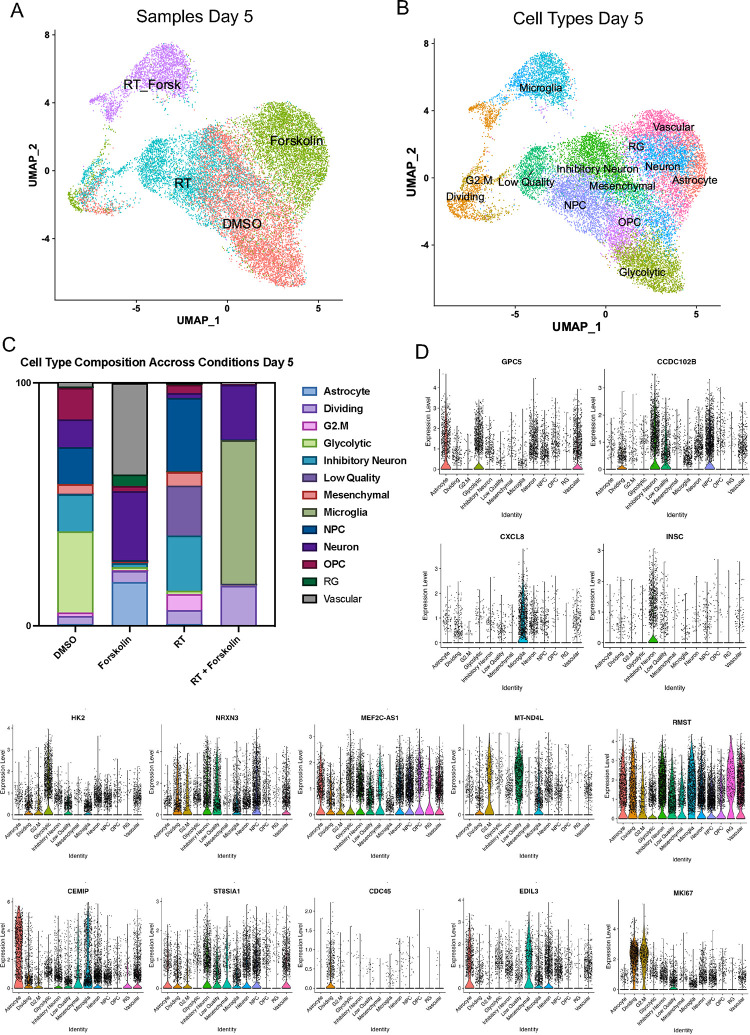
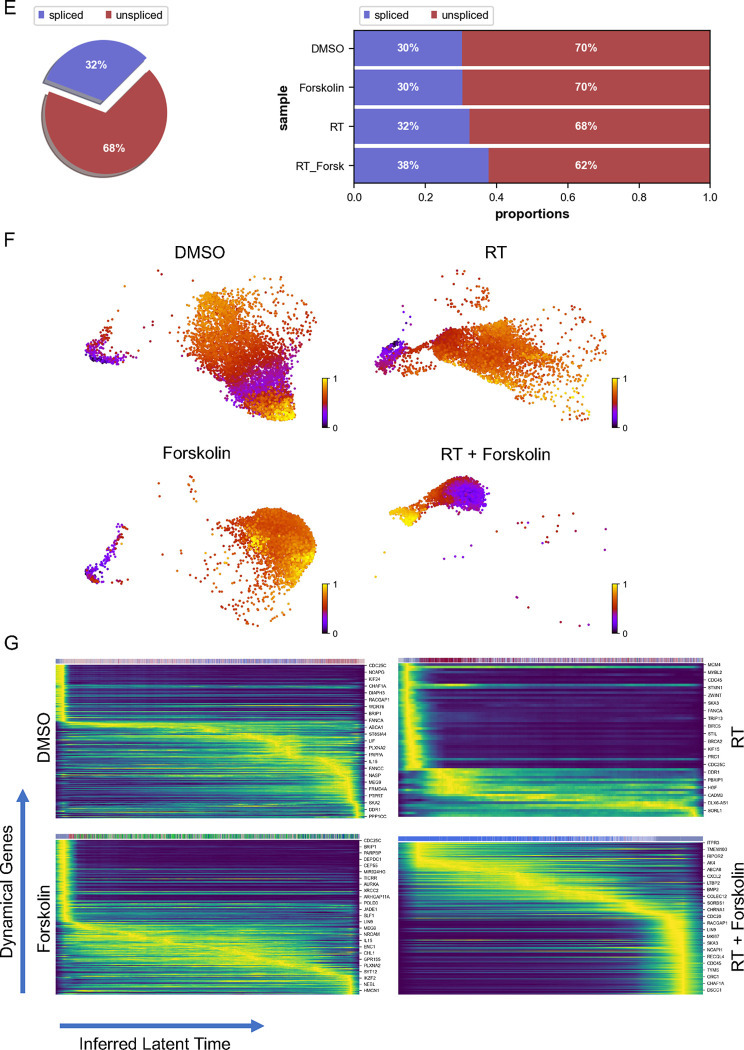
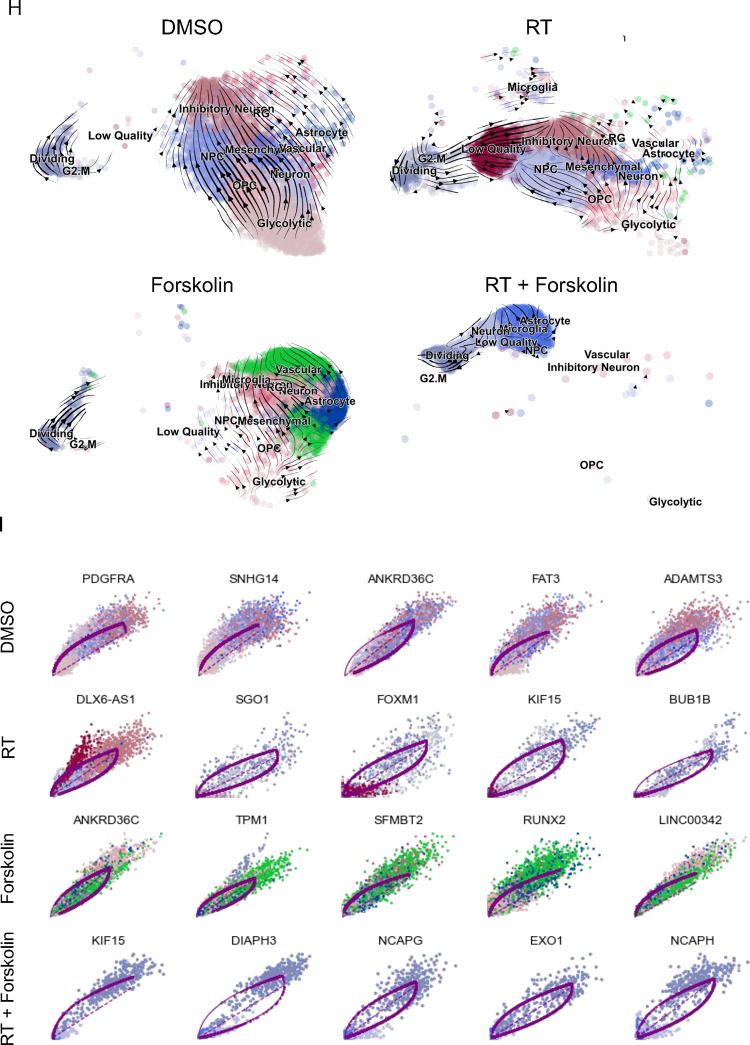
Figure 5. scRNAseq of HK-374 glioma cells (day 5).

UMAP plots (A) of 24 identified clusters that could be attributed to the different treatments. Cell type annotations are shown in B. Stacked columns show the distribution of the different cell types for each treatment condition (C). Violin plots of marker genes for the identified cell types are shown in D. Percentage of spliced and unspliced RNA in all samples and in each treatment condition (E). UMAP plot of latent time for all 4 conditions (F). Plot of dynamical genes against inferred latent time for all samples (G). Trajectory analysis for all four conditions (H). Expression of the top 5 driver genes for each condition over latent time (I). Transcription factor engagement for all predicted cell types calculated using a Bayesian model (BITFAM) (J).


