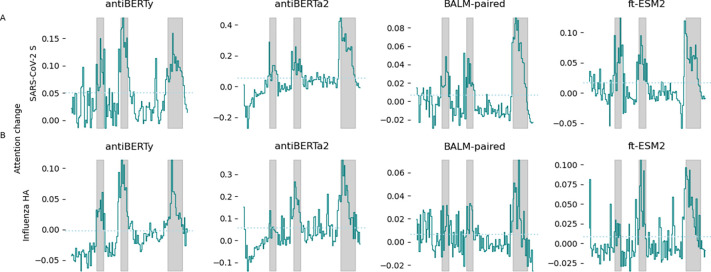
Figure 3. Change in average intra-heavy chain attention after fine-tuning.
Attention activations were extracted from pre-trained and fine-tuned language models for 50 randomly selected antibodies specific for SARS-CoV-2 S protein (A) and influenza HA (B), respectively. The intra-heavy chain attention activations were averaged across heads and layers for each position on the heavy chain. Differences in average attention activations before and after fine-tuning for the last three layers were computed. The x-axis represents the position along the heavy chain. The solid line indicates the mean change in average attention activations across the 50 antibodies. The gray background indicates the regions spanned by CDR of the antibodies. The dotted line represents the mean of the difference in attention activations.

