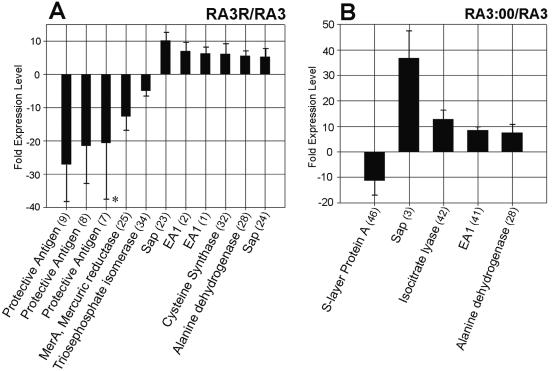
FIG. 4.
Differentially expressed protein spots in (A) the pXO2-cured RA3R strain and (B) the plasmidless RA3:00 strain compared to the virulent RA3 (pXO1+ pXO2+) isolate. Bacteria were grown under inducing conditions (0.85% [wt/vol] bicarbonate, 5% CO2, 37°C). Expression corresponds to the ratio of the volumes of matched spots between RA3:00 or RA3R and RA3. Positive values correspond to protein overexpression; negative values refer to protein underexpression. Numbers in parentheses refer to spot numbers as in Fig. 2A or B. *, protective antigen (spot 7) was expressed at variable levels in RA3 but with consistent down-regulation in RA3R. The error bars indicate standard deviations.

