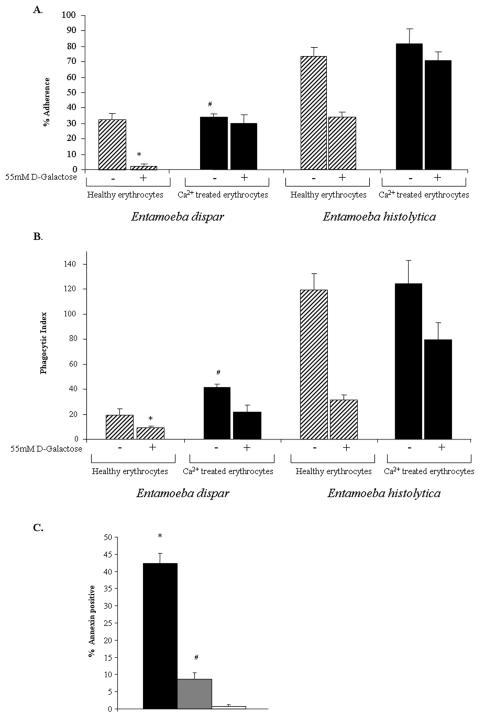
FIG. 6.
E. dispar displays reduced adherence, PS exposure, and phagocytosis of erythrocytes relative to E. histolytica, along with an even greater defect in cytolysis. (A) Adherence of amebae to healthy (hatched bars) and calcium-treated (black bars) erythrocytes. Adherent cells were defined as trophozoites with at least three adherent erythrocytes (means ± SD; n = 3; * indicates a P value of <0.01 for E. dispar adherence to healthy versus calcium-treated erythrocytes in 55 mM d-galactose; # indicates a P value of <0.001 for E. dispar adherence to calcium-treated erythrocytes compared to that of E. histolytica). (B) Phagocytosis of healthy or calcium-treated erythrocytes by amebae (reported as the phagocytic index described in the legend to Fig. 3; means ± SD; n = 3). Following calcium treatment (2.5 mM), cells were stained with TAMRA, quenched, and then spun onto amebae and incubated at 37°C for 15 min at a 20:1 erythrocyte-to-ameba ratio. Uningested erythrocytes were lysed in water, and the cells were counted by microscopy (* indicates a P value of <0.005 for E. dispar ingestion of healthy erythrocytes with 55 mM d-galactose compared to that of healthy erythrocytes without d-galactose; # indicates a P value of <0.01 for E. dispar ingestion of calcium-treated erythrocytes in 55 mM d-galactose versus E. dispar ingestion of healthy erythrocytes with 55 mM d-galactose). (C) Exposure of PS on the outer leaflet of the membrane of erythrocytes measured by annexin V-FITC staining and flow cytometry. Surface changes caused by E. histolytica (black bars), E. dispar (grey bars), or M199S alone (white bars) are shown (* indicates a P value of <0.001 for healthy erythrocytes incubated with E. histolytica compared to that of healthy erythrocytes in M199S; # indicates a P value of <0.05 for healthy erythrocytes incubated with E. dispar compared to that of healthy erythrocytes in M199S. Data are reported as means ± SD; n = 3).

