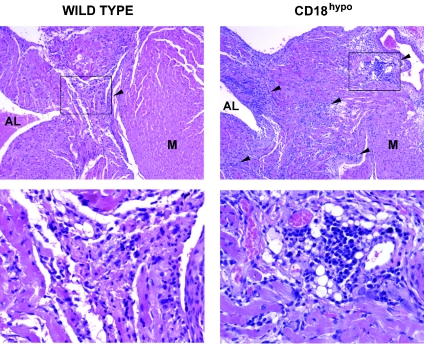
FIG. 3.
HE staining of heart sections from WT and CD18 hypomorph CD18hypo mice, 3 weeks after B. burgdorferi infection. The top left panel shows the base of the heart of an infected wild-type mouse, with a carditis severity score of 2, while the top right panel shows a comparable area from a CD18 hypomorph mouse, with a severity score of 3, both at a magnification of ×100. The scores selected represent the median score for each experimental group. The arrows point to some of the areas of infiltration. Note that the areas of infiltration in the CD18 hypomorph mouse are more abundant, dense, and extensive compared to WT mice. AL, atrium lumen; M, myocardial tissue. The bottom panels correspond to the insets of the picture directly above, blown up to a magnification of ×400. Sparse mononuclear cell infiltration is observed in WT (bottom left panel), compared to the heavy mononuclear cell infiltrate in the CD18 hypomorph (bottom right panel). Pictures were taken with SpotAdvanced software.

