Figure 1.
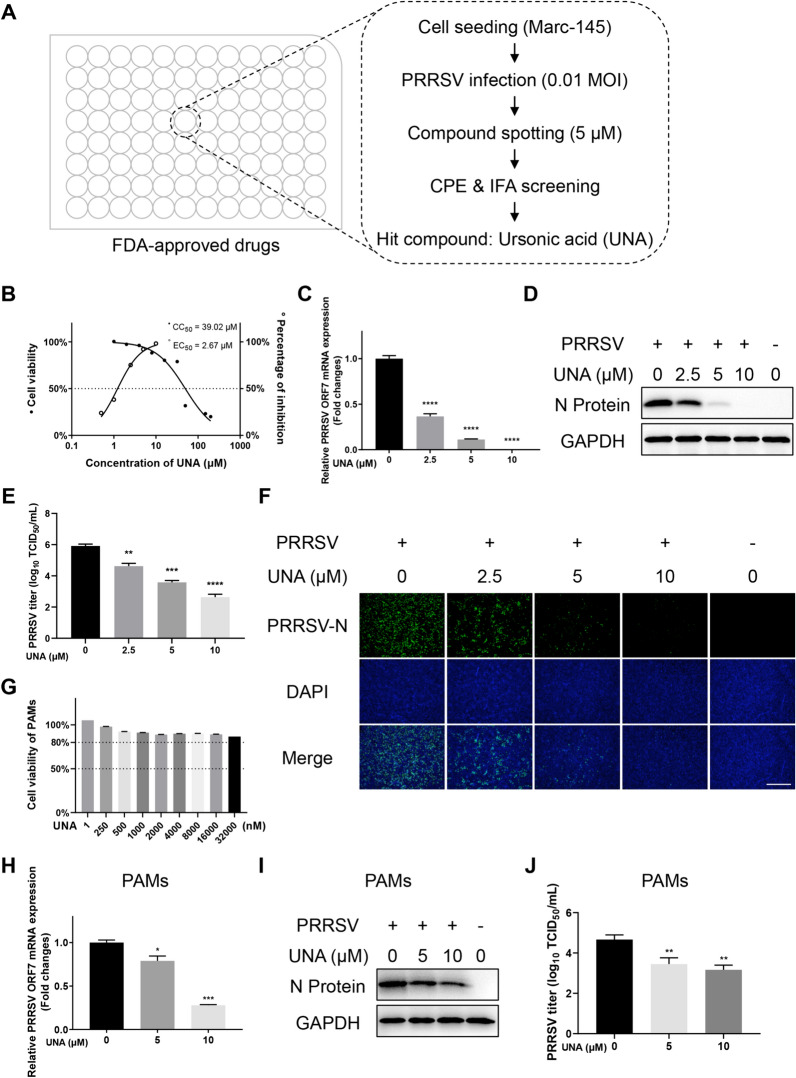
Identification of the anti-PRRSV activity of ursonic acid (UNA) in vitro. A High-throughput screening (HTS) assay flowchart. B 50% cytotoxic concentration (CC50) and 50% effective concentration (EC50) of UNA in Marc-145 cells. C Relative PRRSV ORF7 mRNA levels in Marc-145 cells determined by RT‒qPCR. GAPDH was used as the internal loading control. D Western blotting of the PRRSV N protein in Marc-145 cells infected with PRRSV and treated with the indicated concentrations of UNA. E Virus titration of samples from Marc-145 cells by TCID50 calculation. F IFA images of Marc-145 cells (PRRSV-infected and UNA-treated) at 48 hpi. The PRRSV N protein is green, and the nuclei are blue. Scale bars, 500 μm. G Viability of PAMs treated with the indicated concentrations of UNA for 24 h. H Relative PRRSV ORF7 mRNA levels in PAMs determined by RT‒qPCR. β-Actin was used as the internal loading control. I Western blot of the PRRSV N protein in PAMs infected with PRRSV and treated with UNA or DMSO at 24 hpi. J Virus titration of samples from PAMs by TCID50 calculation. The results are from one of three independent experiments. The data are presented as the means ± SDs. The asterisks in the figures indicate significant differences (*, P < 0.05; **, P < 0.01; ***, P < 0.001; ****, P < 0.0001; ns, not significant).

