Figure 2.
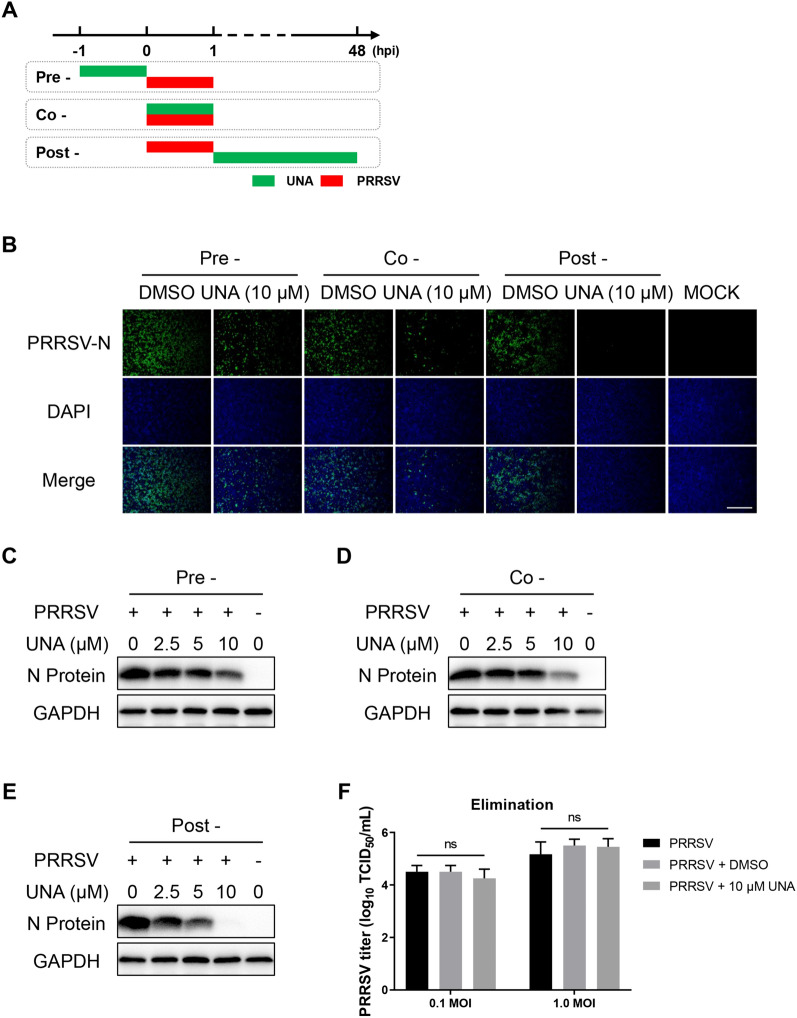
UNA suppresses PRRSV replication in various treatment stages in the time-of-addition assay. A Schematic illustration of the time-of-addition experiment. B IFA images of Marc-145 cells (PRRSV-infected and UNA-treated) at 48 hpi. The viral N protein is green, and the nuclei are blue. Scale bars, 500 μm. C–E Western blotting of the PRRSV N protein in Marc-145 cells infected with PRRSV and treated with UNA or DMSO (including pre, co, and post-treatment modes) at 48 hpi. F TCID50 detection for the virucidal activity assay. The results are from one of three independent experiments. The data are presented as the means ± SDs. The asterisks in the figures indicate significant differences (*, P < 0.05; **, P < 0.01; ***, P < 0.001; ****, P < 0.0001; ns, not significant).

