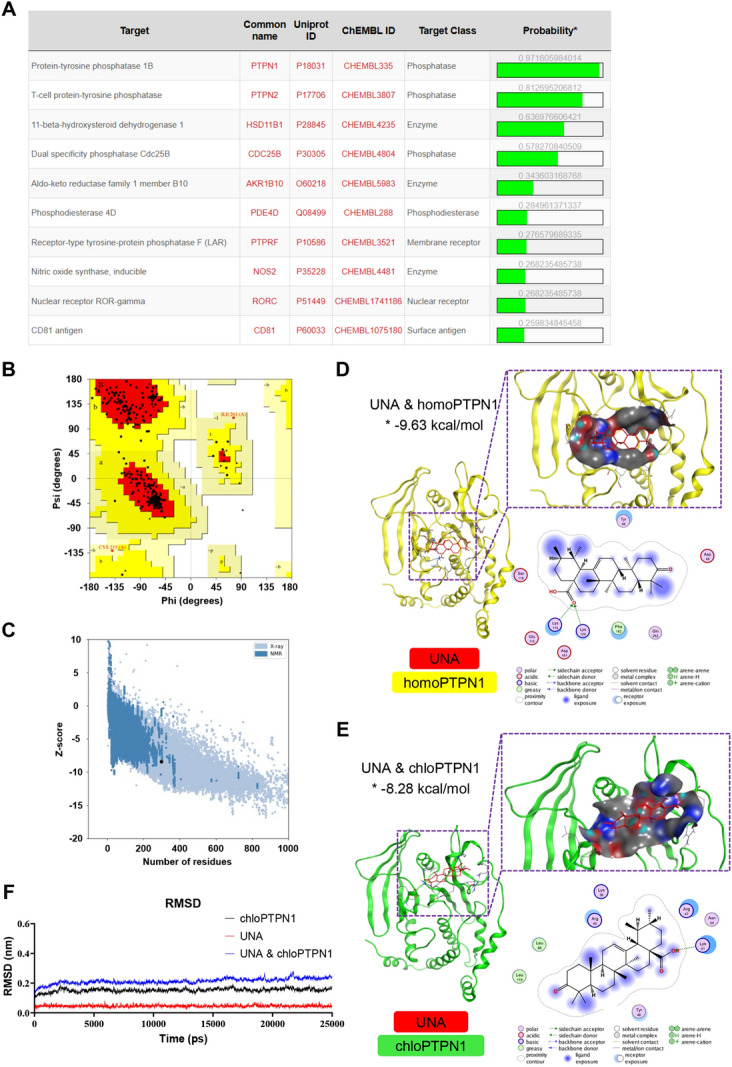
Figure 3.

In silico target prediction and molecular docking analysis of UNA. A Target prediction for UNA (only the top 10 predicted proteins are listed). B The Ramachandran plot statistics of Chlorocebus sabaeus PTPN1 (chloPTPN1) represent the most favourable, additional allowed, generously allowed, and disallowed regions, with percentages of 91.1, 8.2, 0.7, and 0%, respectively. C The Z score of chloPTPN1 was −8.4. D Docked conformation of homoPTPN1 (PDB: 2F71) with UNA. The compound and protein are represented as lines and cartoons, respectively. UNA is coloured red, and the protein homoPTPN1 is coloured yellow. The binding site is shown as a cavity structure. The binding energy of the UNA-homoPTPN1 complex, which was calculated using Autodock, is marked with an asterisk. E Docked conformation of chloPTPN1 with UNA. UNA is coloured red, and the protein chloPTPN1 is coloured green. The binding site is shown as a cavity structure. The binding energy of the UNA-chloPTPN1 complex, which was calculated using Autodock, is marked with an asterisk. F RMSD values of chloPTPN1 (black), UNA (red), and the UNA and chloPTPN1 complex (blue) over the 25 ns simulation time.
