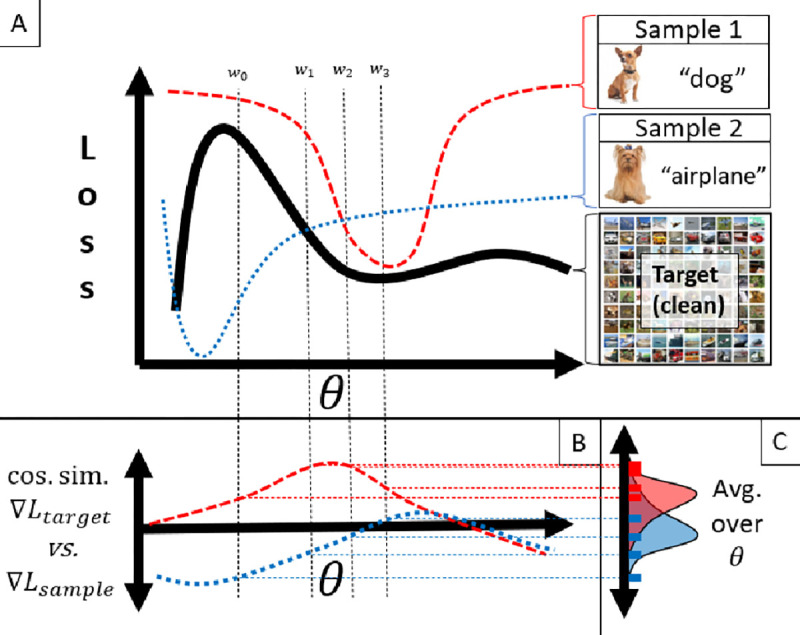
Figure 1:

We propose a method of data valuation that compares each source sample to the target samples by computing the similarity of gradients during stochastic gradient descent. In panel A, we depict a toy-example of a 1-d loss landscape. Sample 1 (red) is an accurately labeled (high-quality), whereas sample 2 (blue) is incorrectly labeled (low quality). In panel B, we plot the similarity of each source sample gradient compared to the target set gradient (black solid line in panel A). Panel C shows the marginal distribution of gradient similarities, which is averaged to obtain the final source sample data value. To make this process tractable, gradient similarities are computed over a limited number of model parameter values during traditional stochastic gradient descent. The computed gradients are visualized by dotted lines in panels A,B and . To choose the relevant values of , we use stochastic gradient descent (SGD), with gradients calculated from the target set.
