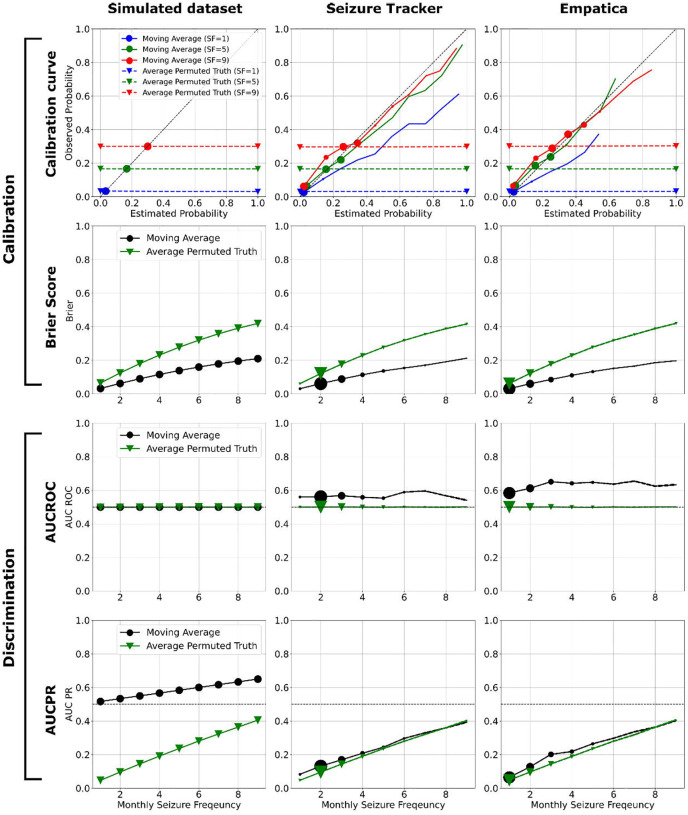
Figure 1.
Twelve scenarios comparing the performance of MA vs. permuted truth. The calibration curve, brier score, AUCROC, and AUCPR are shown in rows. The results of simulated, Seizure Tracker, and Empatica datasets are shown in columns. In the calibration curves (first row), the monthly seizure frequencies 1, 5, and 9 are shown in blue, green, and red. The results of MA and permuted truth are indicated by solid line and dash line. The marker size indicates the normalized number of diaries within each estimated probability bin. Since the MA outcomes for the simulated dataset are constant, there is only one estimated probability in the calibration curve, resulting in a single marker instead of a solid line. The brier score, AUCROC, and AUCPR of MA and permuted truth are indicated by black and green solid lines respectively in the second, third, and fourth rows. The marker size indicates the normalized number of diaries within each SF bin. Note that in all twelve comparisons, MA performs as well or better than permuted truth. Additionally, within this range of SF, all metrics except AUCROC vary monotonically with seizure frequency. Higher SF values were explored in simulation (Appendix).

