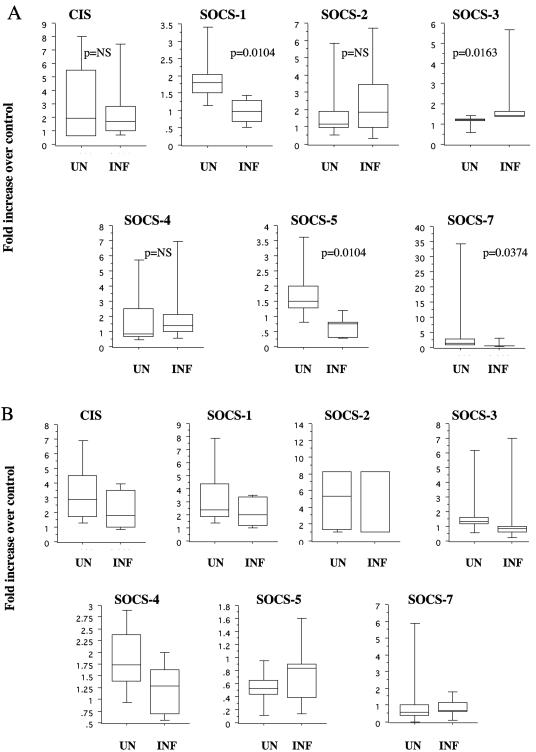
FIG. 3.
Expression of CIS, SOCS-1, SOCS-2, SOCS-3, SOCS-4, SOCS-5, and SOCS-7 in filarial infections. (A) T-cell expression of CIS, SOCS-1 to SOCS-5, and SOCS-7 following 24 h of stimulation with BmA is depicted as the n-fold change over the medium control. (B) T-cell expression of CIS, SOCS-1 to SOCS-5, and SOCS-7 following 24 of h stimulation with anti-CD3 is depicted as the n-fold change over the medium control. The results are expressed as box plots with the horizontal lines representing the 25th, 50th, and 75th percentiles and the vertical lines representing the 10th and 90th percentiles of the data. P values were calculated using the Mann-Whitney test. NS, not significant.

