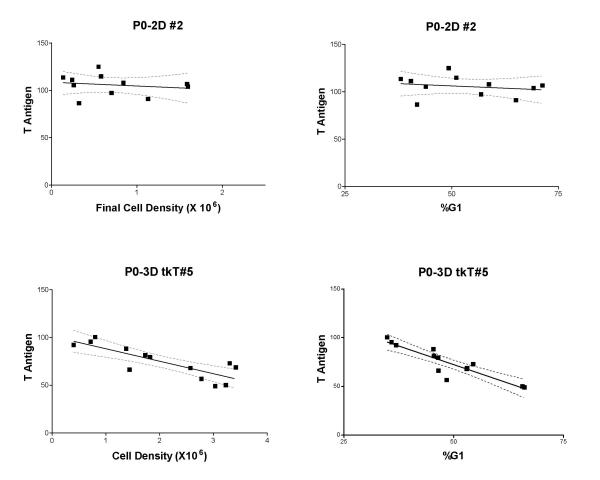
Figure 6.
Exponential growth related Tag expression. The density and %G1 related expression profiles are show for a cell line that does not show a significant density related change (top) and one that does (bottom). P0-2D#2 expresses Tag from the retroviral LTR and P0-3DtkT#5 expresses Tag from the htk promoter. Dashed lines represent the 95% confidence interval about the regression line.

