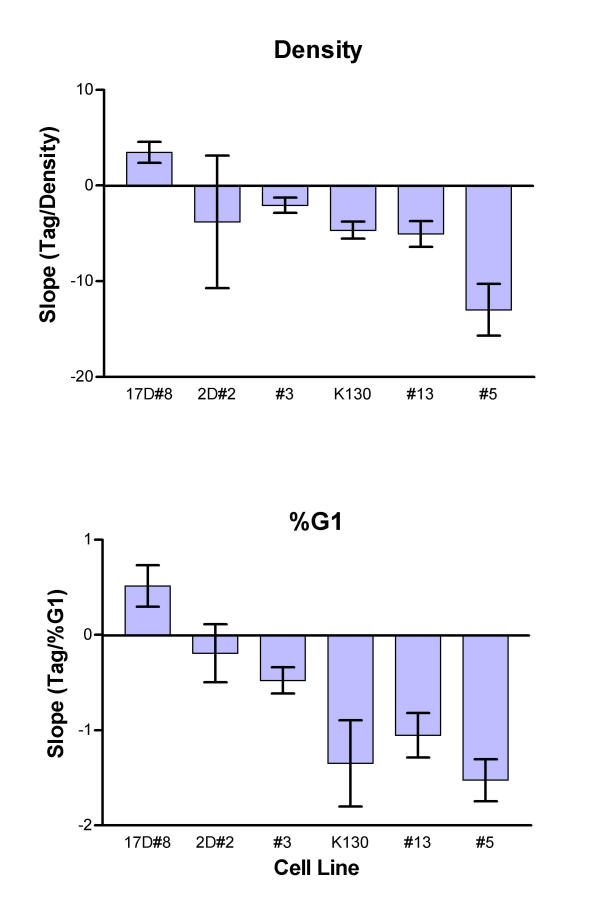
Figure 7.
Density related rate of change in Tag expression. Slopes and SE for each cell line determined as shown in Figures 4 and 5 are plotted. All data are significantly different from zero except 2D#2. See Table 1. Cell line names have been abbreviated: #3 = 3DtkT#3, #13 = 13DtkT#13, #5 = 13DtkT#5.

