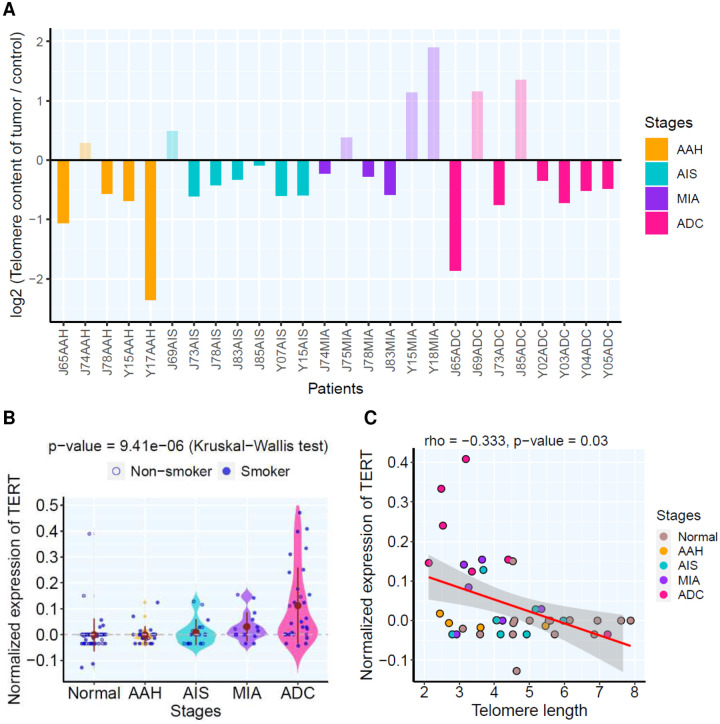
Figure 3. The telomere length and TERT expression in each lesion.
(A) Each bar represents the relative telomere length (RTL) in each lesion based on WGS profiling. (B) TERT expression amongst different histological stages. Each blue dot represents normalized expression of TERT in each pulmonary nodule and the solid brown dots represent the mean expression of all lesions of each histologic stage. Kruskal-Wallis H test was used for comparing normalized TERT expression between all stages. (C) The correlation of absolute telomere length by WGS profiling and normalized TERT expression between lesions (only lesions profiled by both WGS and RNAseq) assessed by two-tailed Spearman’s correlation analysis. Each dot represents each lesion from Normal (brown), AAH (orange), AIS (cyan), MIA (purple) and ADC (rose), respectively.

