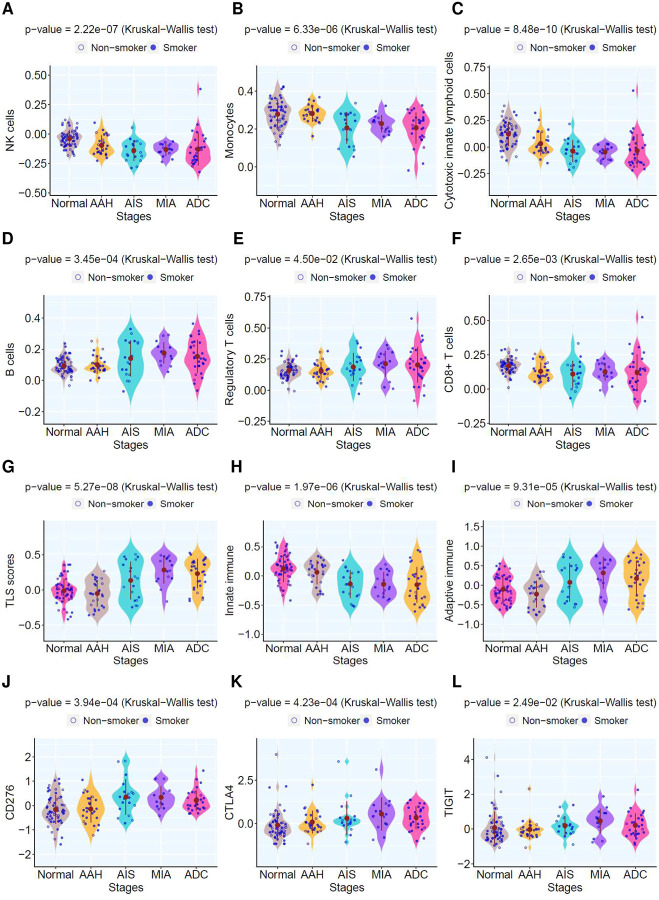
Figure 6. Immune cell infiltration and immune gene expression in lesions of different histological stages.
Representative innate immune cell infiltration (A–C) and adaptive immune cell infiltration (D–F) based on deconvolution using Consensus amongst different histological stages. Each blue dot represents averaged enrichment score inferred in each pulmonary lesion and the solid brown dots represent the mean enrichment score of all lesions in each histologic stage. Kruskal–Wallis H test was used to compare the enrichment score across stages. The GSVA enrichment score of genes associated with tertiary lymphoid structures (TLS) (G), innate immunity (H) and adaptive immunity (I), respectively. (J–L) Normalized expression of representative immune checkpoint genes across stage.

