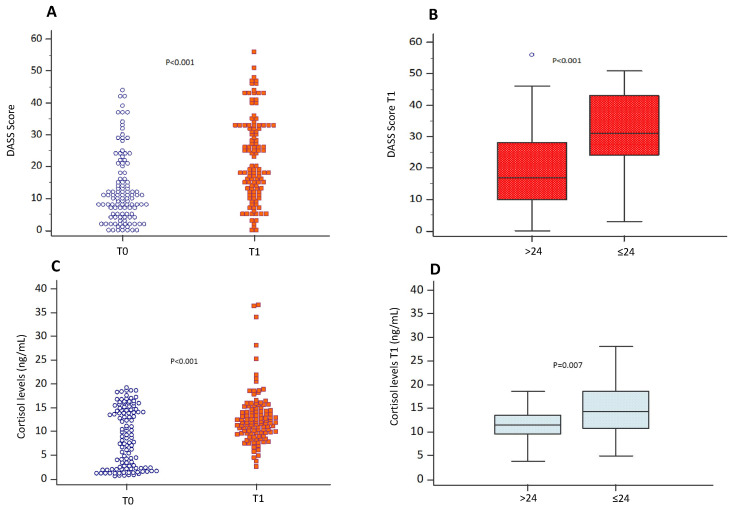
Figure 1.
Perceived stress and cortisol levels. DASS score (A) and salivary cortisol levels (C) evaluated during the semester (T0) and on the day of the exam before the test (T1) in students (n = 144). Data are represented by dot plots and expressed as median and interquartile ranges [IQRs]. Statistical differences were assessed using the Wilcoxon signed-rank test. DASS scores (B) and salivary cortisol levels (D) on the day of the exam before the test (T1) in the group of students who obtained an exam score > 24 and ≤24, respectively. Data are expressed as median and interquartile ranges [IQRs]. Statistical differences were assessed using the Wilcoxon signed-rank test.

