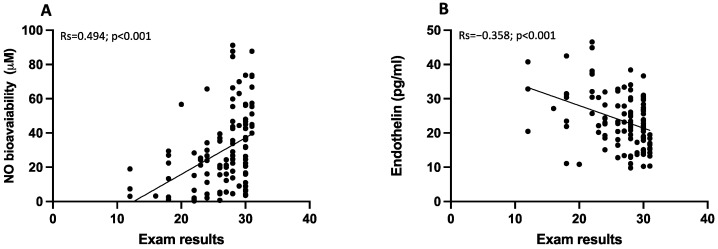
Figure 5.
Correlation analysis examining the association between endothelial function and exam results. Scatter plots showing significant (2-tailed) Spearman correlation of NO bioavailability (A), and endothelin (B) in vertical vs horizontal directions of exam results. Spearman’s test was used for correlation analysis. p < 0.05 was considered significant.

