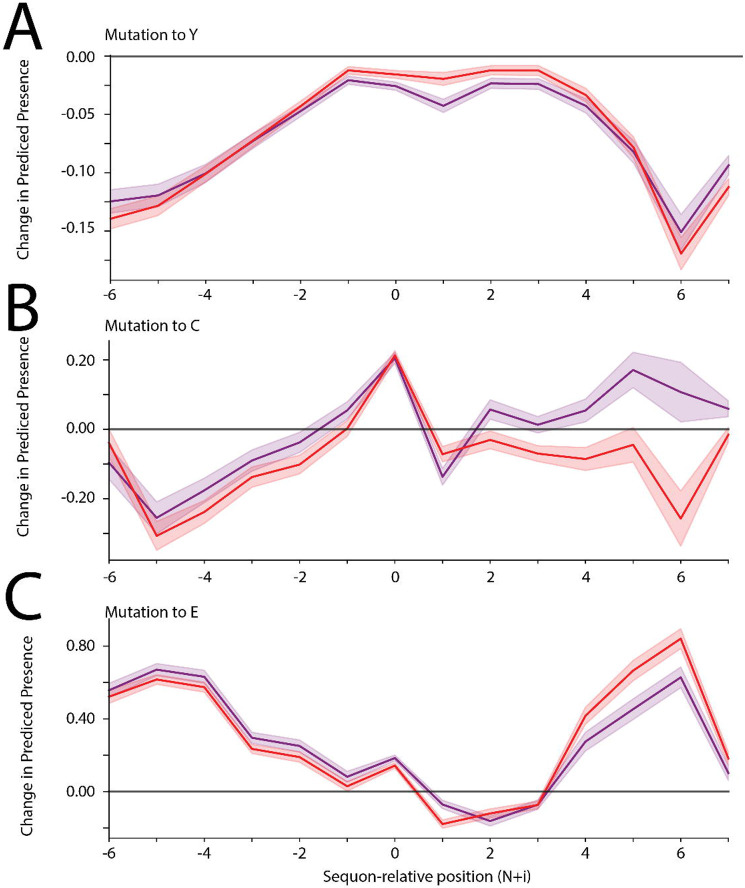
Figure 3 -. Effects of amino acid substitutions on predicted glycosylation ranges.
A-C) For all N-linked glycosites in our dataset, we substituted each amino acid with tyrosine (A), cysteine (B), or glutamate (C) and input the modified glycosite-flanking sequences into our InSaNNE model and predicted feasible glycosylation. We then calculated the average change (predicted presence difference) compared to the predicted wild-type glycosylation glycosites; shown here with a 95% confidence interval. Lines for changes to fucosylated (red) and sialylated (purple) glycans are shown. See Supplementary Figure 3 for analogous plots for other amino acid substitutions.

