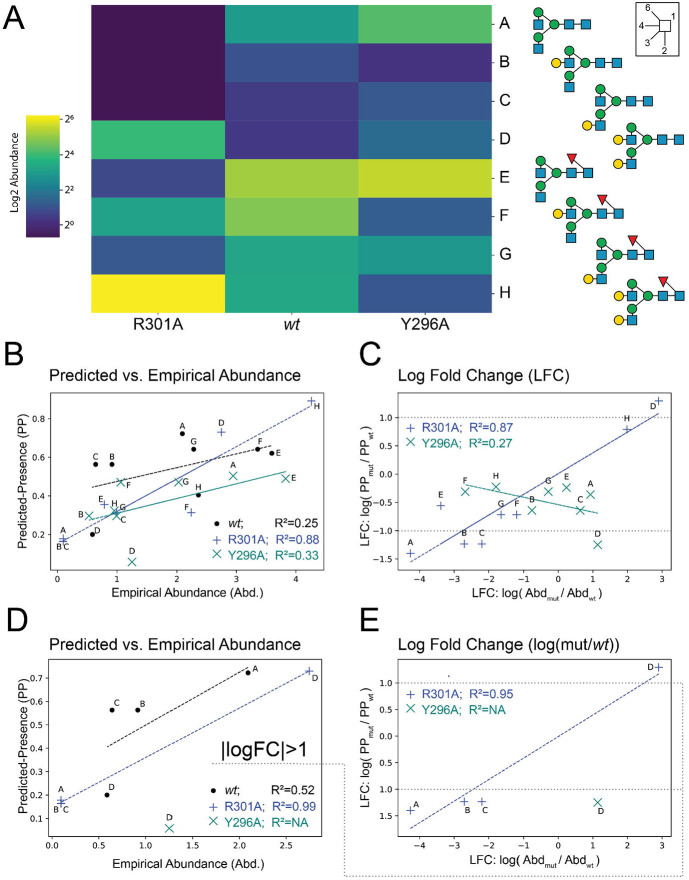
Figure 6 -. InSaNNE predictions of relative abundance on IgG3.
A) Heatmap showing the log-scale abundance of various glycan species observed in wt and mutant Fc on human IgG3.9 B) The background-adjusted InSaNNE predicted-presence is compared with the empirical abundance in wild type (black), R301A mutant (blue), and the Y296A mutant (teal). C) Log fold change between glycan abundance for mutants relative to wildtype were compared between empirical and predicted abundance for all glycans. D-E) The bottom panels mirror panels B-C except glycans with a predicted absolute log fold-change less than 1 were removed.

