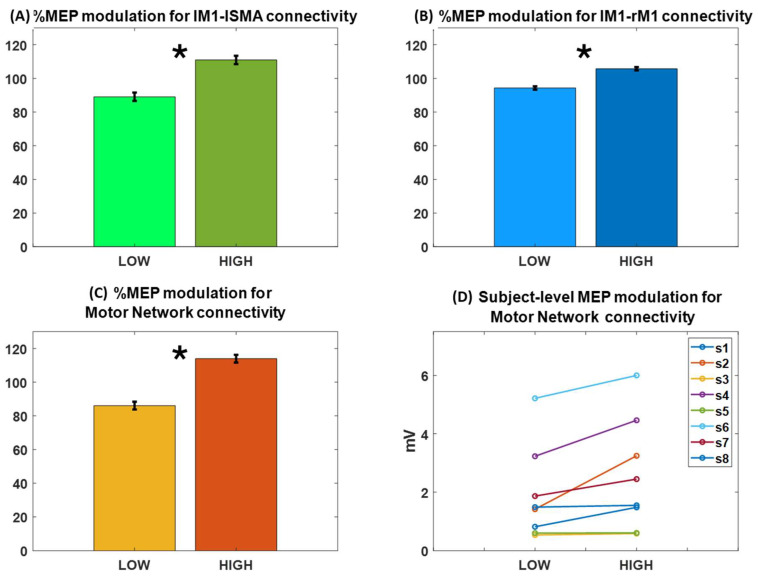
Figure 2.
MEP amplitude modulation and percentage values in trials with high (HC) and low (LC) connectivity and median split-based definition. Bars indicate mean MEP amplitude in the corresponding set of trials, which across all subjects and whiskers indicate the standard error of the mean. (A) MEP modulation (one-tail paired sample t-test, * p = 0.03) for connectivity between the left motor cortex (lM1) and the left supplementary motor area (lSMA). (B) MEP modulation (one-tail paired sample t-test, * p = 0.01) for connectivity between lM1 and the right motor cortex (rM1). (C) MEP modulation (one-tail paired sample t-test, * p = 0.01) in the subset of trials in which connectivity between lM1 and lSMA and connectivity between lM1 and rM1 are simultaneously low (LC_network) or high (HC_network). (D) A positive modulation of connectivity with MEP amplitude (logarithmic value of MEP amplitudes is shown on the y-axis) was observed in the majority of the subjects.

