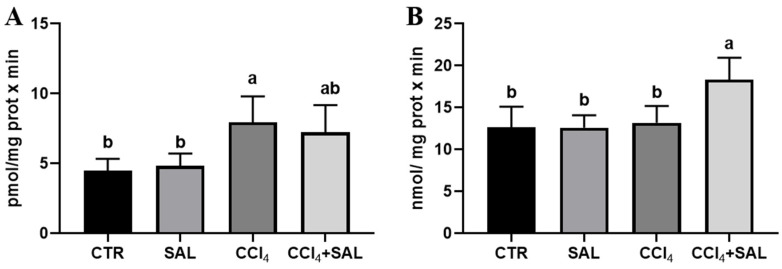
Figure 5.
Heme oxygenase (A) and DT-diaphorase (B) activities in liver of all CTR, SAL, CCl4, and CCl4 + SAL rats, performing three replicates for each animal. Values are expressed as mean ± SD of rats in each group (n = 10) and reported as pmol/(mg protein × min) for heme oxygenase and as nmol/(mg protein × min) for DT-diaphorase. a, b: values significantly different with a one-way ANOVA-test (p ≤ 0.05).

