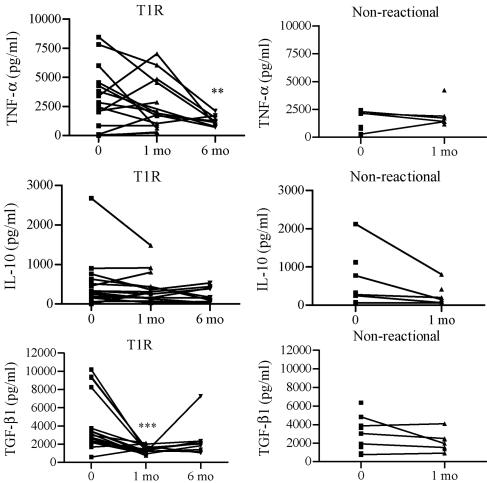
FIG. 1.
Levels of TNF-α, IL-10, and total TGF-β1 responses to MLSA in PBMC from patients with T1R and nonreactional patients before and during treatment. PBMC were cultured for 20 h in the presence of MLSA. Cytokine levels in culture supernatants were detected with the ELISA. Each line represents a patient. Statistical differences compared with zero time are indicated as follows: two asterisks, P < 0.01; and three asterisks, P < 0.001.

