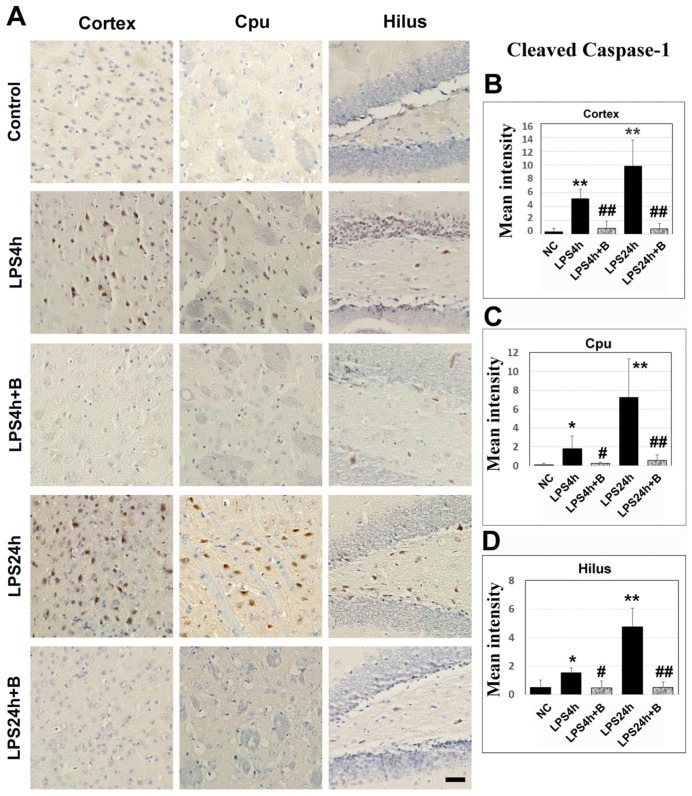
Figure 8.
Caspase-1 immunohistochemistry in B355252-treated and LPS-injected animals. (A) Representative photomicrographs of caspase-1 staining. Positive cells are labeled in brown, and nuclei are counterstained with hematoxylin. The scale bar = 100 µm. (B–D) Summarized caspase-1 mean intensity in the cortex, Cpu, and hilus. LPS increased the caspase-1imuunoreactivity after 4 h and 24 h in the cortex, Cpu, and hilus. However, B355252 prevented these elevations in all three areas at both time points. Data are presented as mean +/− SD. Significance levels are denoted as *, ** for p < 0.05 and p < 0.01 vs. NC; #, ## for p < 0.05, 0.01 vs. LPS24h.

