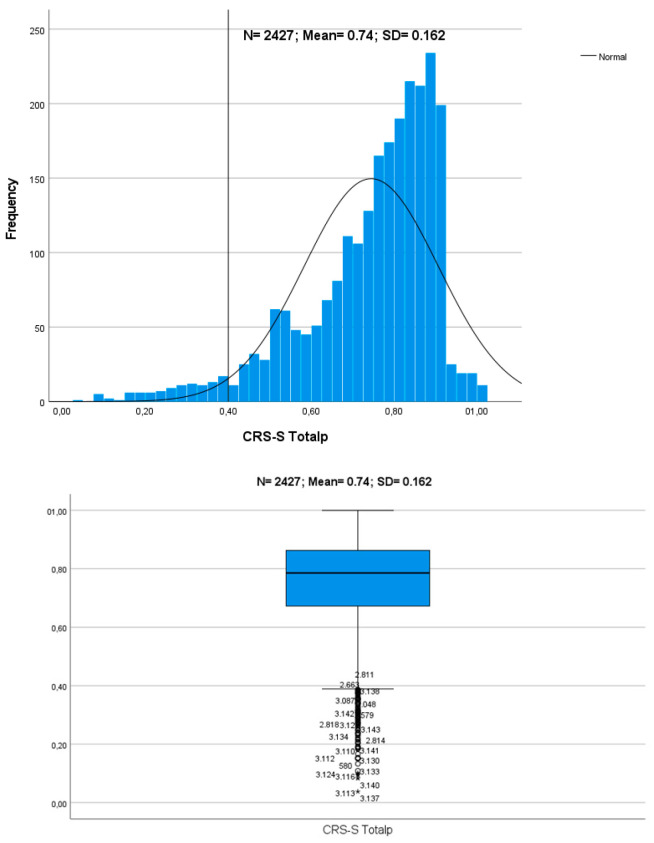
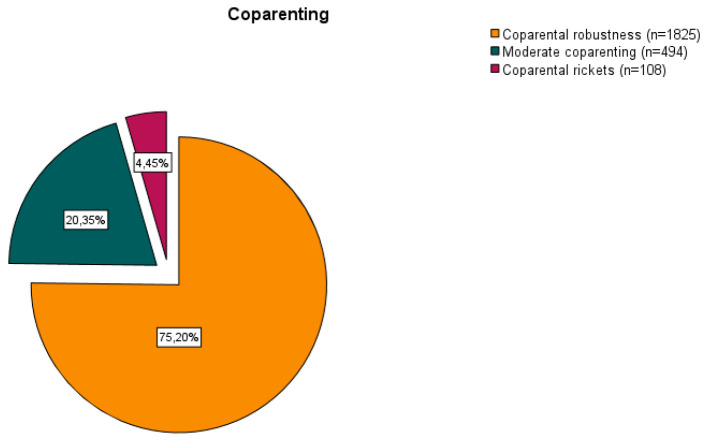
Figure 1.
Distribution of the total weighted score for CRS-S in the group of participants: histogram, box plot, and percentage of participants in each of the three coparenting clusters derived from the result of the two-stage cluster analysis. Note: CRS-S = is the abbreviated way of naming CRS-SEg-S&D. On the left chart, a dividing line is placed at 0.40. This value is the observed (approximate) value of the CRS-S Totalp distribution, below which are found the outliers and the extreme cases. The outliers (represented by circles) and extreme cases (represented by asterisks are visualized in the box plot graph in the center of Figure 1.


