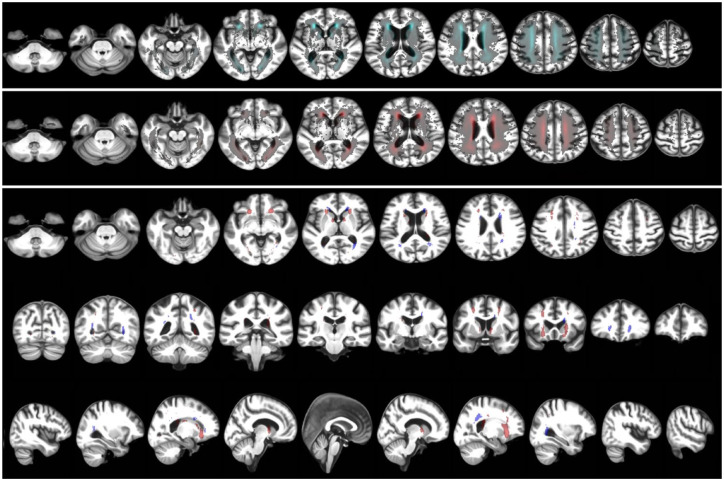
Figure 5.
Probability distribution maps of WMH for the sample of LIS and dICH patients matched in age, sex, and vascular risk factors. The top panel is the WMH probability map of LIS sample. The middle panel is the WMH probability map of dICH sample. The bottom panel shows the differences between both maps thresholded to the highest quartile (75% or above) for LIS patients (compared to dICH) in red, and for dICH patients (compared to LIS) thresholded at 60% or above in blue, in axial, coronal, and sagittal planes.
dICH, deep intracerebral hemorrhage; LIS, lacunar ischemic stroke; WMH, white matter hyperintensities.

