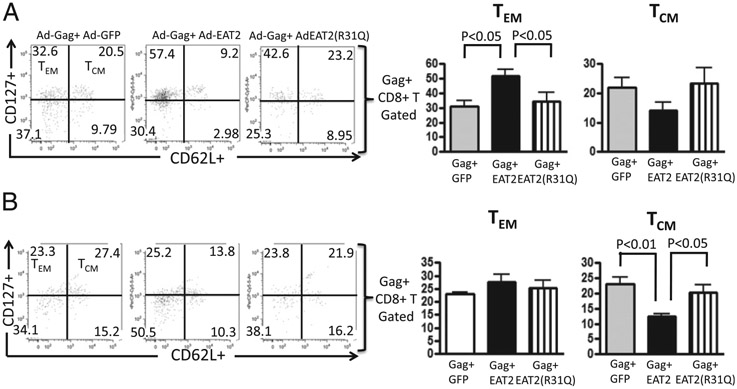
FIGURE 7.
Phenotype analysis of HIV/Gag-specific CD8+ T cells following the homologous prime-boost vaccination of rAd5-HIV/Gag and rAd5-EAT-2. Phenotype analysis of HIV/Gag-specific CD8+ T cells elicited by the homologous rAd5-HIV/Gag and rAd5-EAT-2 prime-boost covaccination regimen were determined at week 34 in peripheral blood and splenocytes by multiparameter tetramer-binding assays. (A) Percentages of Gag-specific TEM and TCM CD8+ cells in PBMCs are shown. (B) Percentages of Gag-specific TEM and TCM CD8+ T cells in splenocytes are shown. The bars represent means ± SD. Statistical analysis was completed using one-way ANOVA with a Student–Newman–Keuls post hoc test. A p value < 0.05 was deemed statistically significant. *p < 0.05 versus naive animals.

