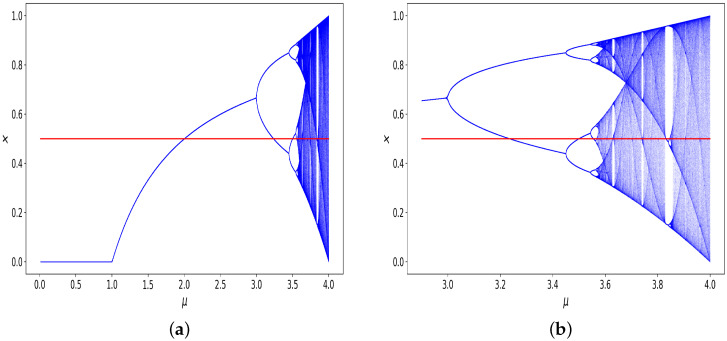
Figure 2.
A bifurcation diagram for the logistic map. In (a), we see the diagram for parameters (0, 4.0]; and in (b), we see the diagram for values (2.9, 4.0]. The value 0.5 has been highlighted in red, to indicate the cut-off threshold used to digitise trajectories by a value of 0 if the output is below the threshold, and a value of 1 if it is greater than or equal to the threshold.

