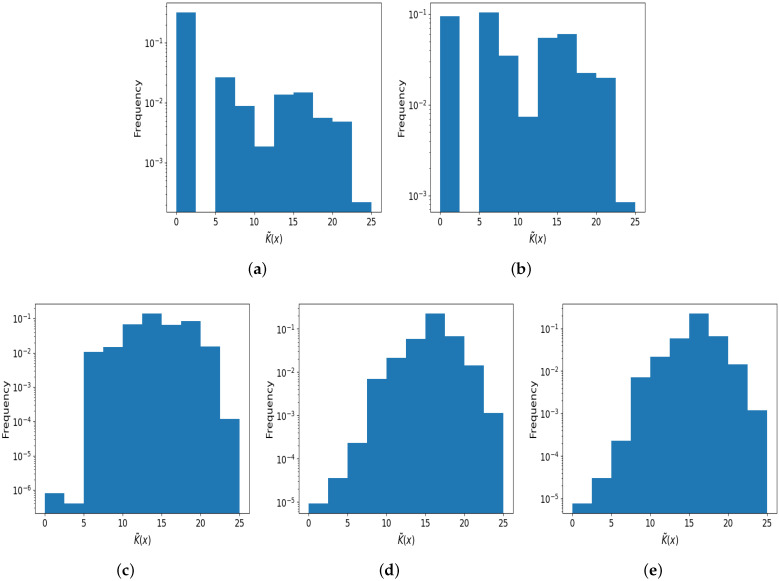
Figure 4.
The distribution of output complexity values, with and sampled from different intervals. (a) A roughly uniform complexity distribution for (0.0, 4.0], with some bias towards lower complexities (mean is 3.4 bits); (b) close to uniform distribution of complexities for [3.0, 4.0], mean is 10.3 bits; (c) the distribution leans toward higher complexities when [3.57, 4.0], mean is 14.1 bits; (d) the distribution is biased to higher complexity values when (mean is 16.4 bits); (e) for comparison, purely random binary strings of 25 bits in length were generated (mean is 16.2 bits). The distributions of complexity values in (d,e) are very similar, but (a–c) show distinct differences. Calculating and comparing is an efficient way of checking how simplicity-biased a map is.

