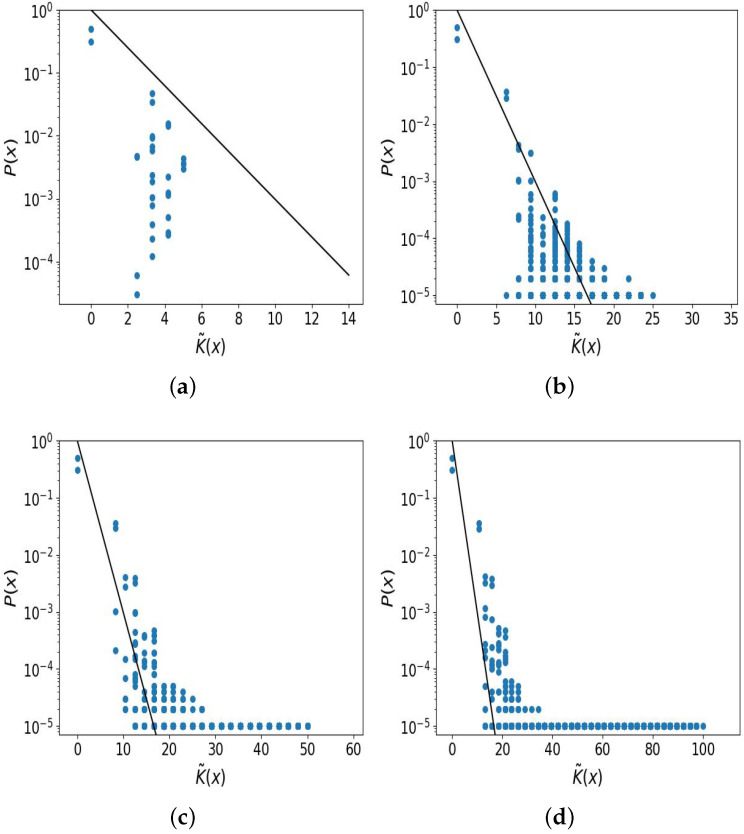
Figure A1.
Simplicity bias with different number of iterations. (a) With iterations, there is some simplicity bias but it is not pronounced; (b) with iterations, the simplicity bias is very clear; with (c) iterations there is still clear simplicity bias, but a long ‘tail’ begins to emerge, illustrating low-frequency patterns; (d) with iterations, there is still some simplicity bias but the ‘tail’ has become more dominant and the simplicity bias is less clear.

