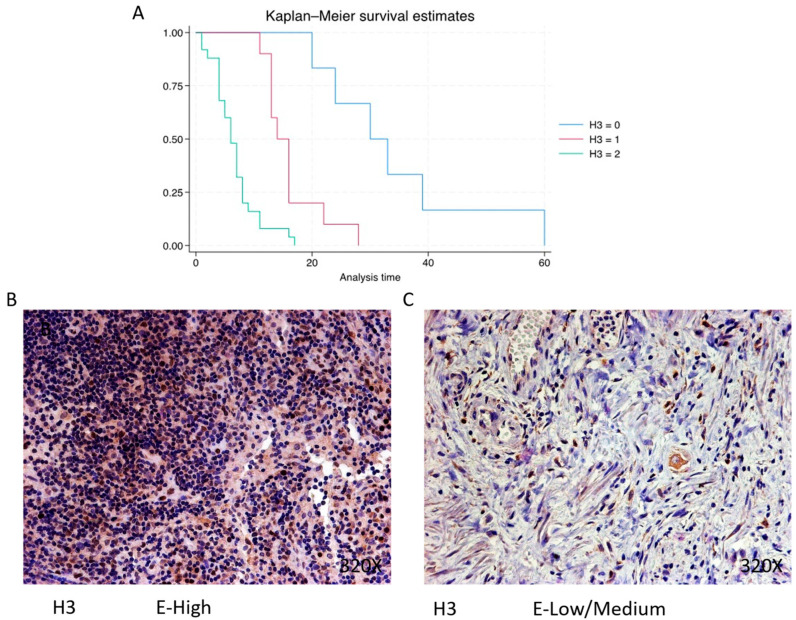
Figure 6.
(A) Kaplan–Meier curves for survival time according to protein expression of H3. Blue curve = negative expression; red curve = low/medium expression; green curve = high expression. (B,C) Images showing histopathological expression of H3 in patients diagnosed with pancreatic cancer. High expression of the protein corresponds to an IRS score of 3, whereas low/medium expression corresponds to an IRS score of 1/2.

