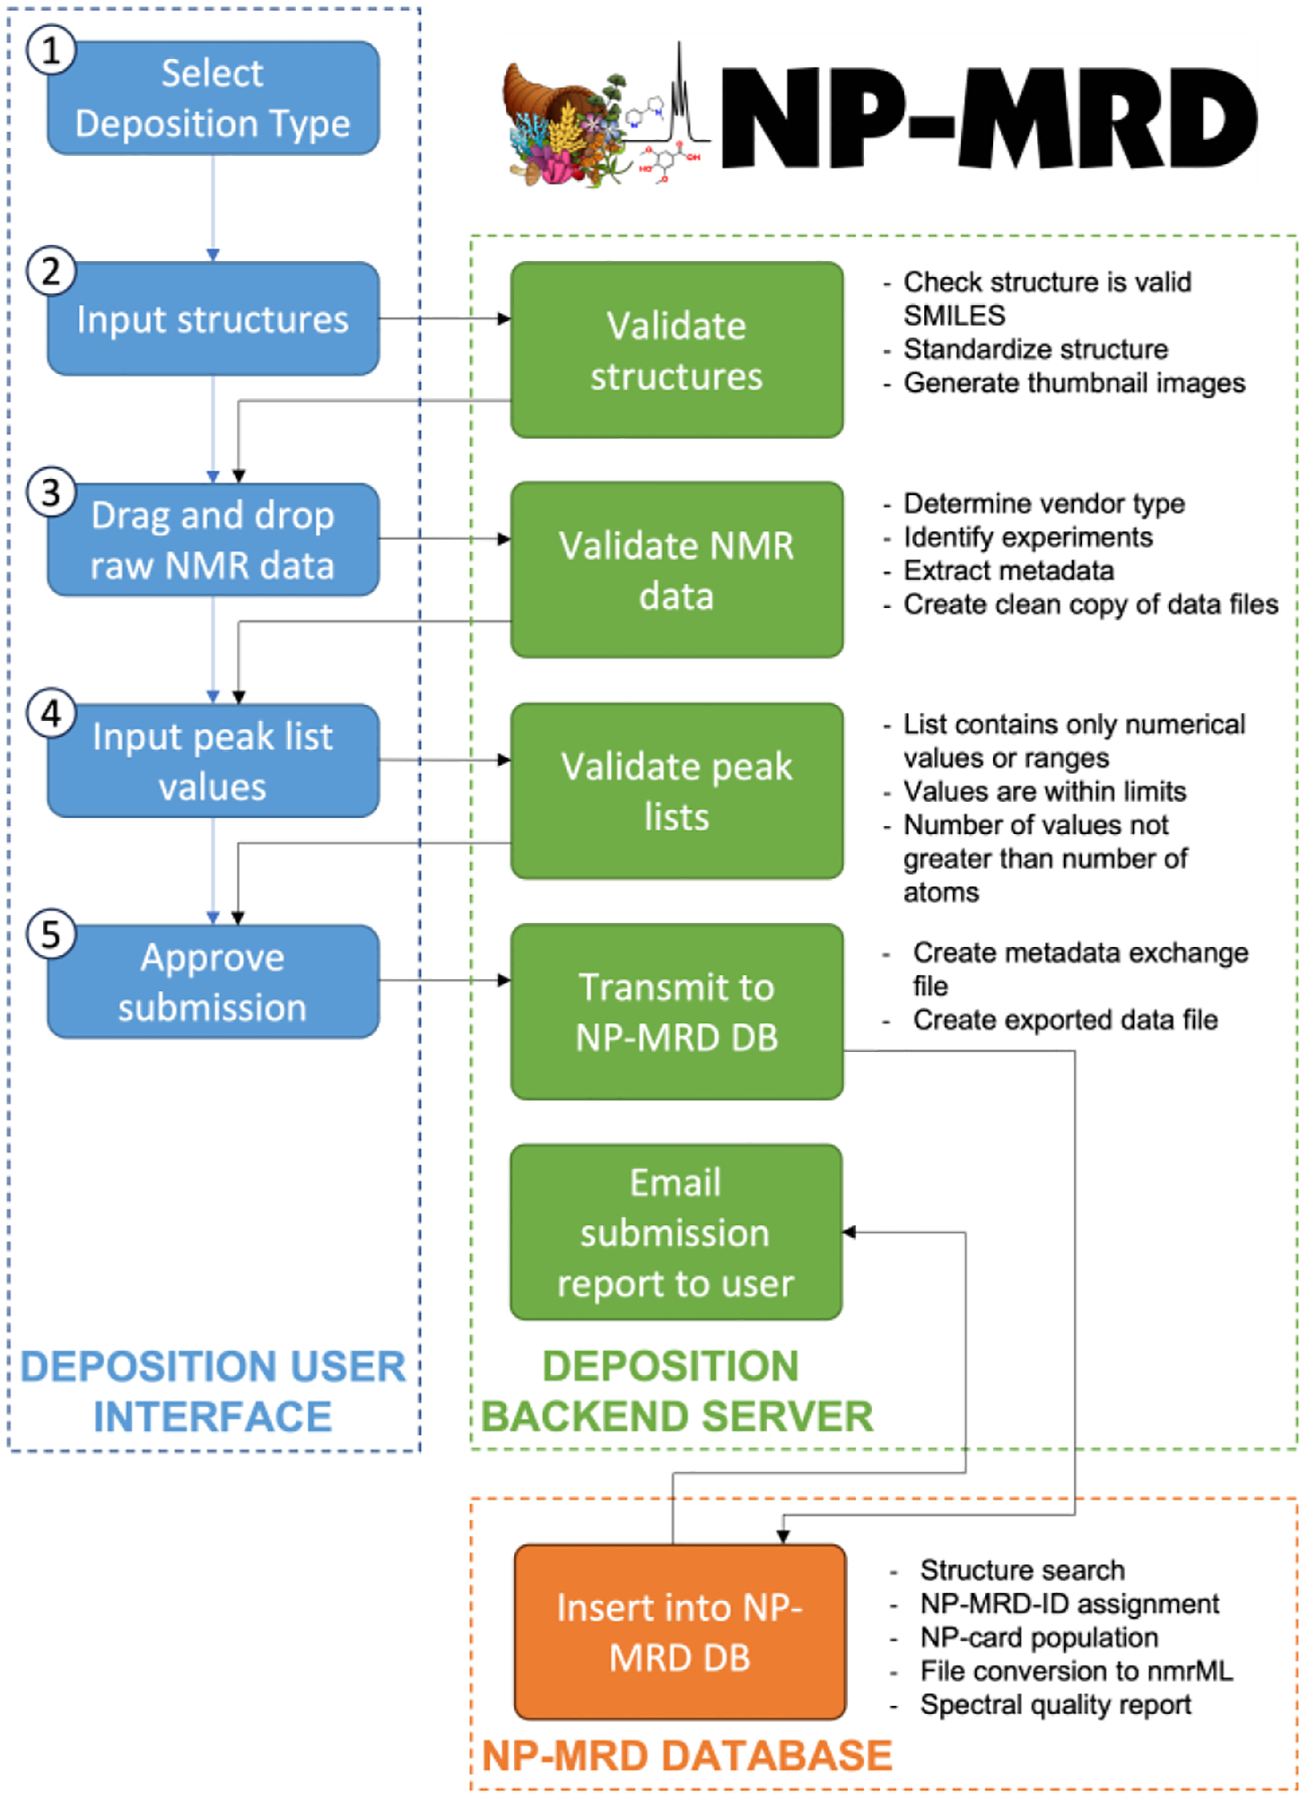
Figure 2:

Schematic of data deposition workflow. Blue boxes represent steps in the deposition process on the frontend webserver. Green boxes represent actions taken on the backend server to validate and standardize submitted data. The orange box represents the main NP-MRD database, to which deposited data are transmitted and from which the insertion report is returned.
