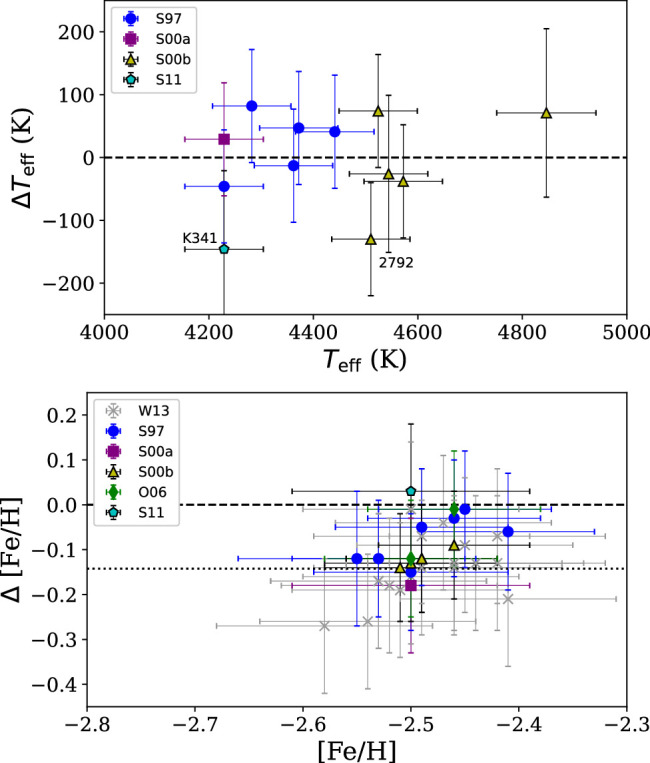
Figure 1.

Comparisons between the effective temperature and [Fe/H] from this paper and those in Sneden et al. (1997, blue circles), Sneden et al. (2000a, purple square), Sneden et al. (2000b, yellow triangles), Otsuki et al. (2006, green diamond), Sobeck et al. (2011, cyan pentagon), and Worley et al. (2013, gray crosses). Note that the Worley et al. (2013) temperatures are not shown in the left panel, since they used photometric temperatures. Differences are calculated as this work—literature values.
