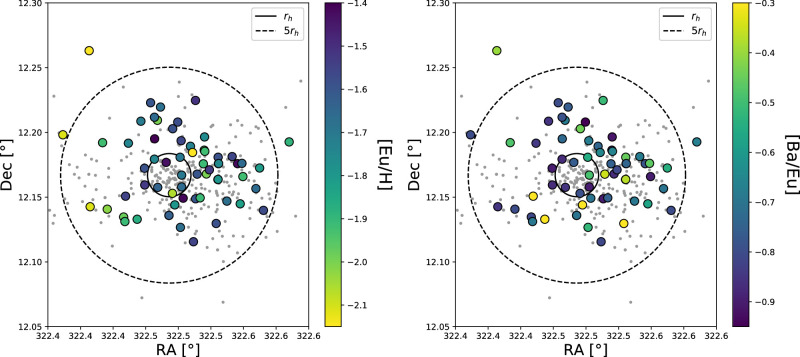
Figure 13.
Positions of stars in M15. The gray points show the stars from Kirby et al. (2016) and Carretta et al. (2009b), while the larger circles show the 62 star from this analysis. For the Kirby et al. (2016) stars, note that the spatial distribution is heavily biased by slit selection constraints. The points are color-coded by [Eu/Fe] (left) and [Ba/Eu] (right). The solid circle shows the half-light radius (Harris 1996; 2010 edition), while the dashed circle shows 5 times the half-light radius.

