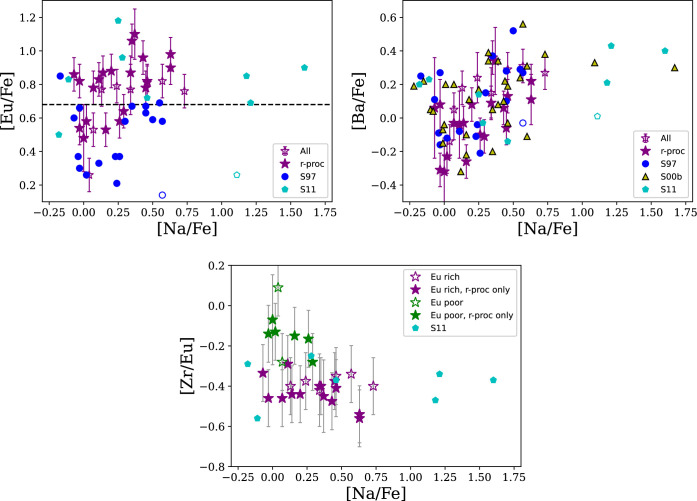
Figure 14.
Trends in neutron-capture abundances as a function of Na abundances. The top panels show [Eu/Fe] and [Ba/Fe] as a function of [Na/Fe], while the bottom panel shows [Zr/Eu] as a function of [Na/Fe]. The stars show the stars from this paper; filled are the stars with r-process patterns, while the open stars are stars with other patterns. Na abundances for these stars are from Sneden et al. (1997, 2000b), Carretta et al. (2009a, 2009b), and Sobeck et al. (2011). The top panels show points from the literature; the open point shows the outlier K583 from Sneden et al. (1997) and Sobeck et al. (2011), as discussed in the text. The dashed line in the [Eu/Fe] panel shows the division between low-Eu and high-Eu stars (see Figure 12). In the bottom panel, the Eu-rich and Eu-poor stars are identified in purple and green, respectively.

