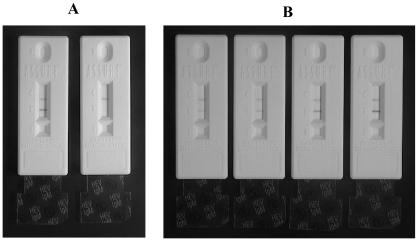
FIG. 1.
Examples of the assembled rapid immunochromatographic test devices with their separators (transparent tabs) at the “removed” (after assay) position. (A) To the left is a device after an assay with a sample from an infected patient and to the right is another after an assay with a sample from a healthy control. The two lines in the viewing window for the positive represent the control (top) and the test (bottom) lines. The negative sample generated the control line only. (B) Examples of intensity scores for the test line (from left to right): 1, 2, 3, and 4, respectively.

