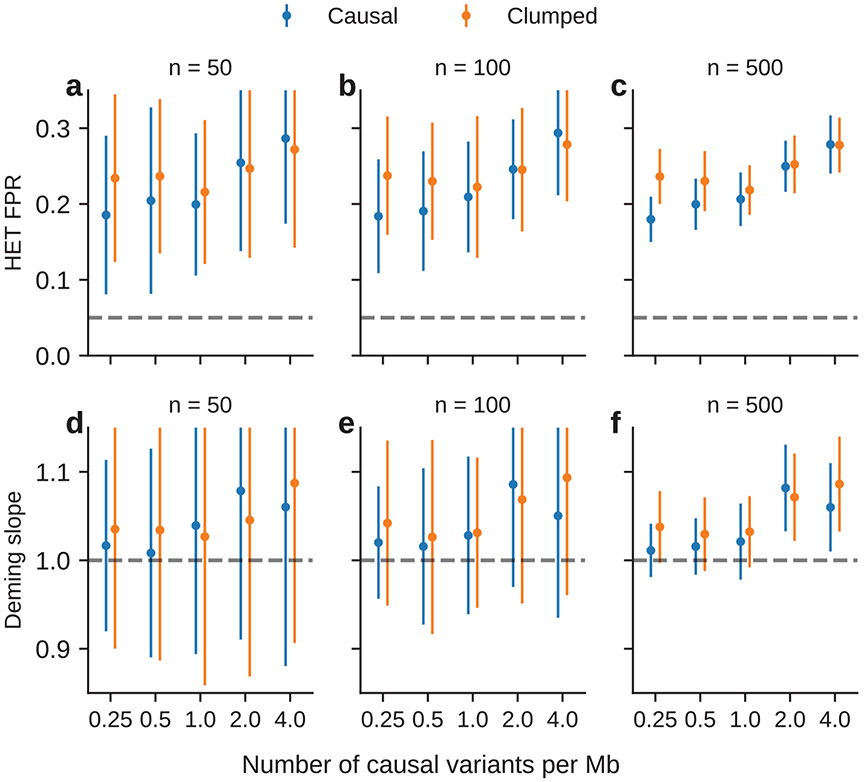
Extended Data Fig. 8 ∣. Simulation with multiple causal variants at other sample sizes (Fig. 6d-f).
Simulations were based on chromosome 1 (515,087 SNPs) and 17,299 PAGE individuals. We drew 62,125, 250, 500, 1000 causal variants to simulate different level of polygenicity, such that on average there were approximately 0.25, 0.5, 1.0, 2.0, 4.0 causal variants per Mb. The heritability explained by all causal variants was fixed at . (a-c) False positive rate of HET test for the causal variants and clumped variants. (d-f) Deming regression slope of estimated ancestry-specific effects for the causal variants and clumped variants. 95% confidence intervals were based on 100 random sub-samplings with each sub-sample consisted of SNPs (instead of n = 1,000 SNPs in Fig. 6c, d) (Methods).

