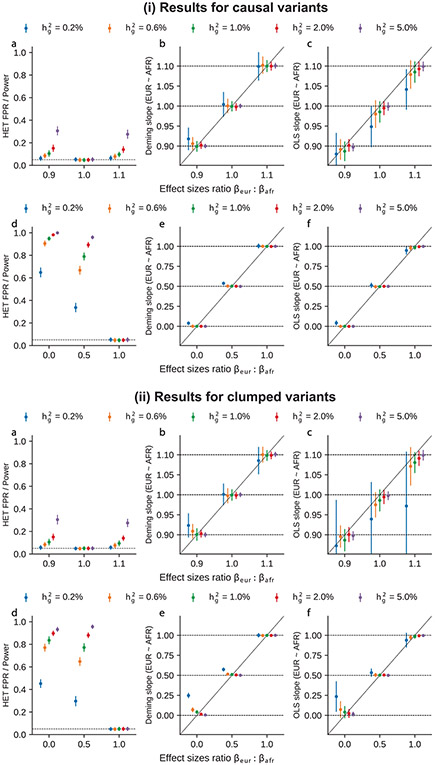
Extended Data Fig. 9 ∣. Additional results for simulations with single causal variant with varying and .
Simulations were based on 100 regions each spanning 20 Mb on chromosome 1 from 17299 PAGE individuals. In each simulation, we randomly selected single causal variant and simulated quantitative phenotypes where these causal variants had varying causal effects across ancestries and each causal variant was expected to explain a fixed amount of heritability (0.2%, 0.6%, 1.0%, 2.0%, 5.0%). We provide results for both causal variants and LD-clumped variants. We separate results into two rows for better visualization: upper row (a-c): ; lower row (d-f): . We show results for False positive rate (FPR) of HET test, Deming regression slope with , and OLS regression slope with . 95% confidence intervals were based on 100 random sub-samplings with each sample consisted of 500 SNPs (Methods). Numerical results and further discussions are provided in Supplementary Table 15.

