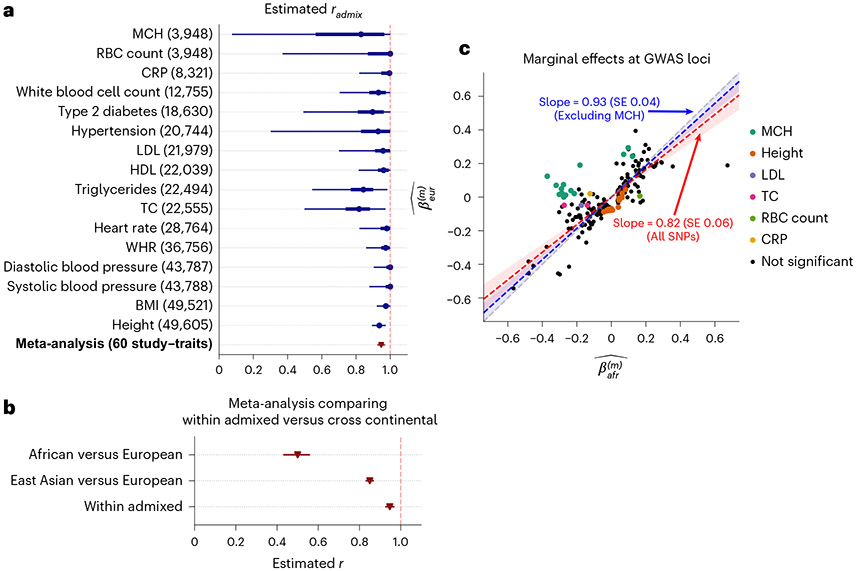
Fig. 3 ∣. Similarity of causal effects and marginal effects across local ancestries meta-analyzed across PAGE, UKBB and AoU.
a, We plot the trait-specific estimated for 16 traits. For each trait, dots denote the estimation modes; bold lines and thin lines denote 50%/95% highest density credible intervals, respectively. Traits are ordered according to total number of individuals included in the estimation (shown in parentheses). These traits are selected to be displayed either because they have the largest total sample sizes, or because the associated SNPs of these traits exhibit heterogeneity in marginal effects (see the panel on the right). We also display the meta-analysis results across 60 study–trait pairs (38 unique traits). Numerical results are provided in Table 1. b, Comparison of (n = 38 traits) to meta-analysis results from transcontinental genetic correlation of African versus European (n = 26 traits) and East Asian versus European (n = 31 traits). Point estimates and 95% confidence intervals are denoted using triangles and lines. c, We plot the ancestry-specific marginal effects for 217 GWAS significant clumped trait–SNP pairs across 60 study–trait pairs. Trait–SNP pairs with significant heterogeneity in marginal effects by ancestry ( via HET test) are denoted in color (non-significant trait–SNP pairs denoted as black dots; some black dots with large differences across ancestries were not significant because of the large standard errors in estimated effects). Numerical results are reported in Supplementary Table 11. Point estimates and 95% confidence intervals for Deming regression slopes of are provided either for all 217 SNPs (red), or for 193 SNPs after excluding 24 MCH-associated SNPs (blue). RBC, red blood cell; CRP, C-reactive protein; LDL, low-density lipoprotein cholesterol; HDL, high-density lipoprotein cholesterol; TC, total cholesterol; BMI, body mass index; WHR, waist-to-hip ratio.

