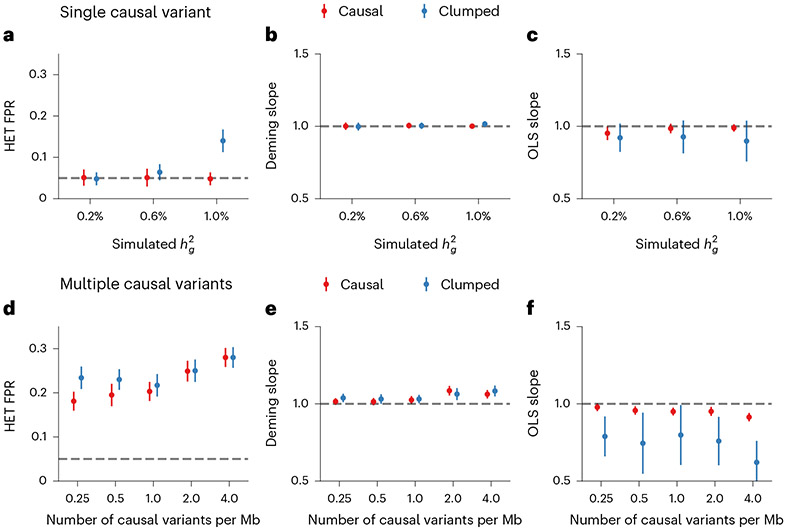
Fig. 6 ∣. Miscalibration of HET test/Deming regression/OLS regression in simulations with .
a–c, Simulations with single causal variant. Each causal variant had the same causal effects across local ancestries and each causal variant explained a fixed amount of heritability (0.2%, 0.6% and 1.0%): false positive rate (FPR) of HET test (a); Deming regression slope (b) and of OLS regression slope (c) of . Numerical results are reported in Supplementary Table 13. d–f, Simulation with multiple causal variants, where we simulated different levels of polygenicity, such that on average there were approximately 0.25, 0.5, 1.0, 2.0 and 4.0 causal variants per Mb; causal variants had the same causal effects across local ancestries, and the heritability explained by all causal variants was fixed at : FPR of HET test (d); Deming regression slope (e) and OLS regression slope (f) of . The 95% confidence intervals were based on 100 random subsamplings with each sample consisting of 1,000 SNPs (Methods). Results for other number of SNPs used for subsampling are shown in Extended Data Fig. 8. Numerical results are reported in Supplementary Table 14.

