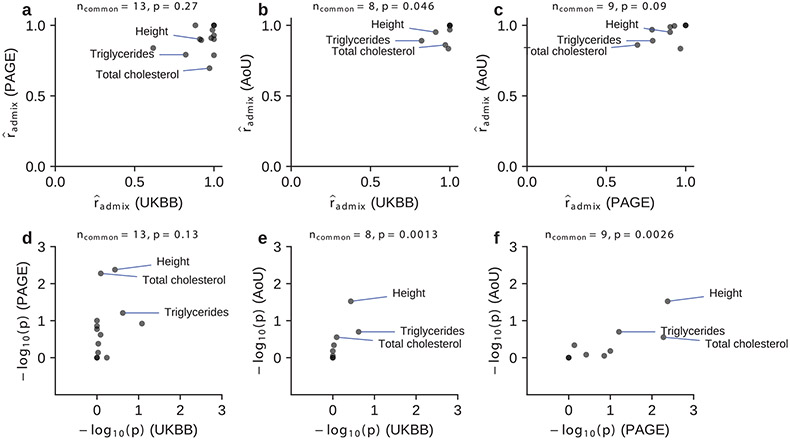
Extended Data Fig. 1 ∣. Consistency of for shared traits across studies.
We compared estimated for shared traits across studies. We compared both (a–c) and (for one-sided test of ; Methods) (d-f). Three traits (Height, Triglycerides, Total cholesterol) with the most significant -values for were annotated. Number of common traits shared across studies and Spearman correlation -value were shown in the title for each panel. Overall, there were weak consistency of estimated for shared traits across studies (although -values for were consistent significantly). Numerical results are reported in Supplementary Table 7.

